

Correlation does not prove causation. Your assumption is that All-Pac 12 = best players and best players then produce wins. It may also be true that players on winning teams are better known and rated higher (as are players that are seniors/been in the league longer). Was Matt Leinert really better than Aaron Rodgers or was Matt Leinert the QB on the undefeated national champion team playing in L. A.?
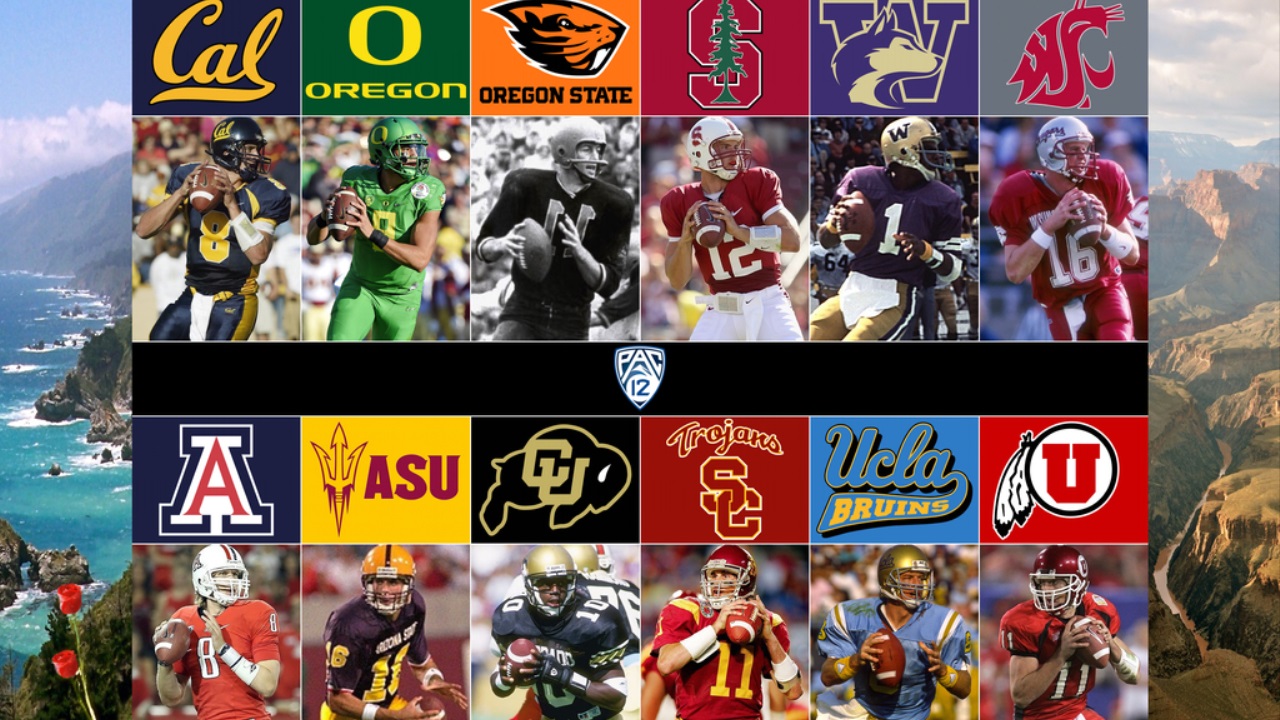
Photo by Pac-12.com
It's quite an honor to be chosen to be on the All Pac 12 football team. The quality of depth and talent in this conference is remarkable and the choices made by the head coaches of the twelve programs are difficult.
Let's start with a simple question. How does the # of players a team gets chosen reflect on their success in terms of wins and losses?
Here's the breakdown of players chosen in the first and second team against the total Pac 12 wins the team had in 2017:
Note: This is not a statisically significant analysis in that we're only looking at 2017
| School | # of 1st/2nd Team Players | # of wins |
| Washington | 12 | 7 |
| USC | 11 | 8 |
| Stanford | 7 | 7 |
| Washington State | 5 | 6 |
| Oregon | 5 | 4 |
| Utah | 5 | 3 |
| UCLA | 4 | 4 |
| Arizona State | 3 | 6 |
| Colorado | 1 | 2 |
| Arizona | 0 | 5 |
| California | 0 | 2 |
| Oregon State | 0 | 0 |
So the correlation isn't exact given the Arizona schools results but the clear top three teams in the conference were indeed the same ones best represented with 1st and 2nd team selections
Look at total players honored to perhaps get a better sense of depth of talent:
| School | Total Honorees | Wins |
| USC | 21 | 8 |
| Washington | 16 | 7 |
| Stanford | 15 | 7 |
| Arizona State | 13 | 6 |
| Oregon | 10 | 4 |
| Washington State | 9 | 6 |
| UCLA | 9 | 4 |
| Utah | 9 | 3 |
| Arizona | 6 | 5 |
| Colorado | 5 | 2 |
| California | 4 | 2 |
| Oregon State | 2 | 0 |
Viewed this way, the rankings become a far tighter fit to the wins and losses in conference. So at least as 2017 reflects, it's a good thing to have more all conference performers if you want to win. How do you get them?
First let's look at experience and how it aligns to 1st and 2nd team selections (not including specialists)
| Years of Experience | # of Selections |
| 5th Year | 3 |
| 4th Year | 17 |
| 3rd Year | 19 |
| 2nd Year | 7 |
| 1st Year | 0 |
The clear takeaway here is that experience matters quite a bit. True frosh are rarely difference makers and it's your upper classmen that make your team a winner.
Of Cal's starters who played enough to merit consideration, how did their years of experience compare?
| Years of Experience | # of Players |
| 5th year | 5 |
| 4th year | 7 |
| 3rd year | 8 |
| 2nd year | 8 |
| 1st year | 1 |
Cal's youth worked against it in placing players on the AP12 team though with 80%+ of its key contributors returning next year, the prospect to have more AP12 players in 2018 is bright
How did the selections foot with recruiting rankings? Let's look at the 1st and 2nd team position players and find out how they were viewed coming out of HS.
| Rankings | # of AP12 1st/2nd team | % of team | % of HS recruits |
| 5 Star | 2 | 4% | 1% |
| 4 Star | 15 | 33% | 10% |
| 3 Star | 27 | 59% | 61% |
| 2 Star and below | 2 | 4% | 28% |
Stars matter! You've got a better chance of being an All Pac 12 player if you were a 4 or 5 star. The limited data set of 2017 suggests its 4 stars you want and 2 stars are risky.
Never miss the latest news from Bear Insider!
Join our free email list