Unit2Sucks said:
Your attribution of a strawman to me is risible. You said that deaths and infections have become decoupled which means that there is no relation. I've claimed that there is a relationship, not that the relationship will remain constant over time (eg the multiplier will not remain constant). As I've noted, the mix has shifted younger (which drives the death rate lower) and that we have improved treatments which further reduce the rate. Nonetheless, some portion of the infected will die weeks after they become infected. Also, the lag will vary over time depending on how early in the infection cycle we are diagnosing people. I would expect we've cut the death rate by at least half if not more, but that it will still be proportional to infected.
"It will still be proportional to infected"
The ratio has decreased by a factor of 4.
I've actually quantified the level of decoupling between the number of new cases and the new deaths, here is what I've said above: t
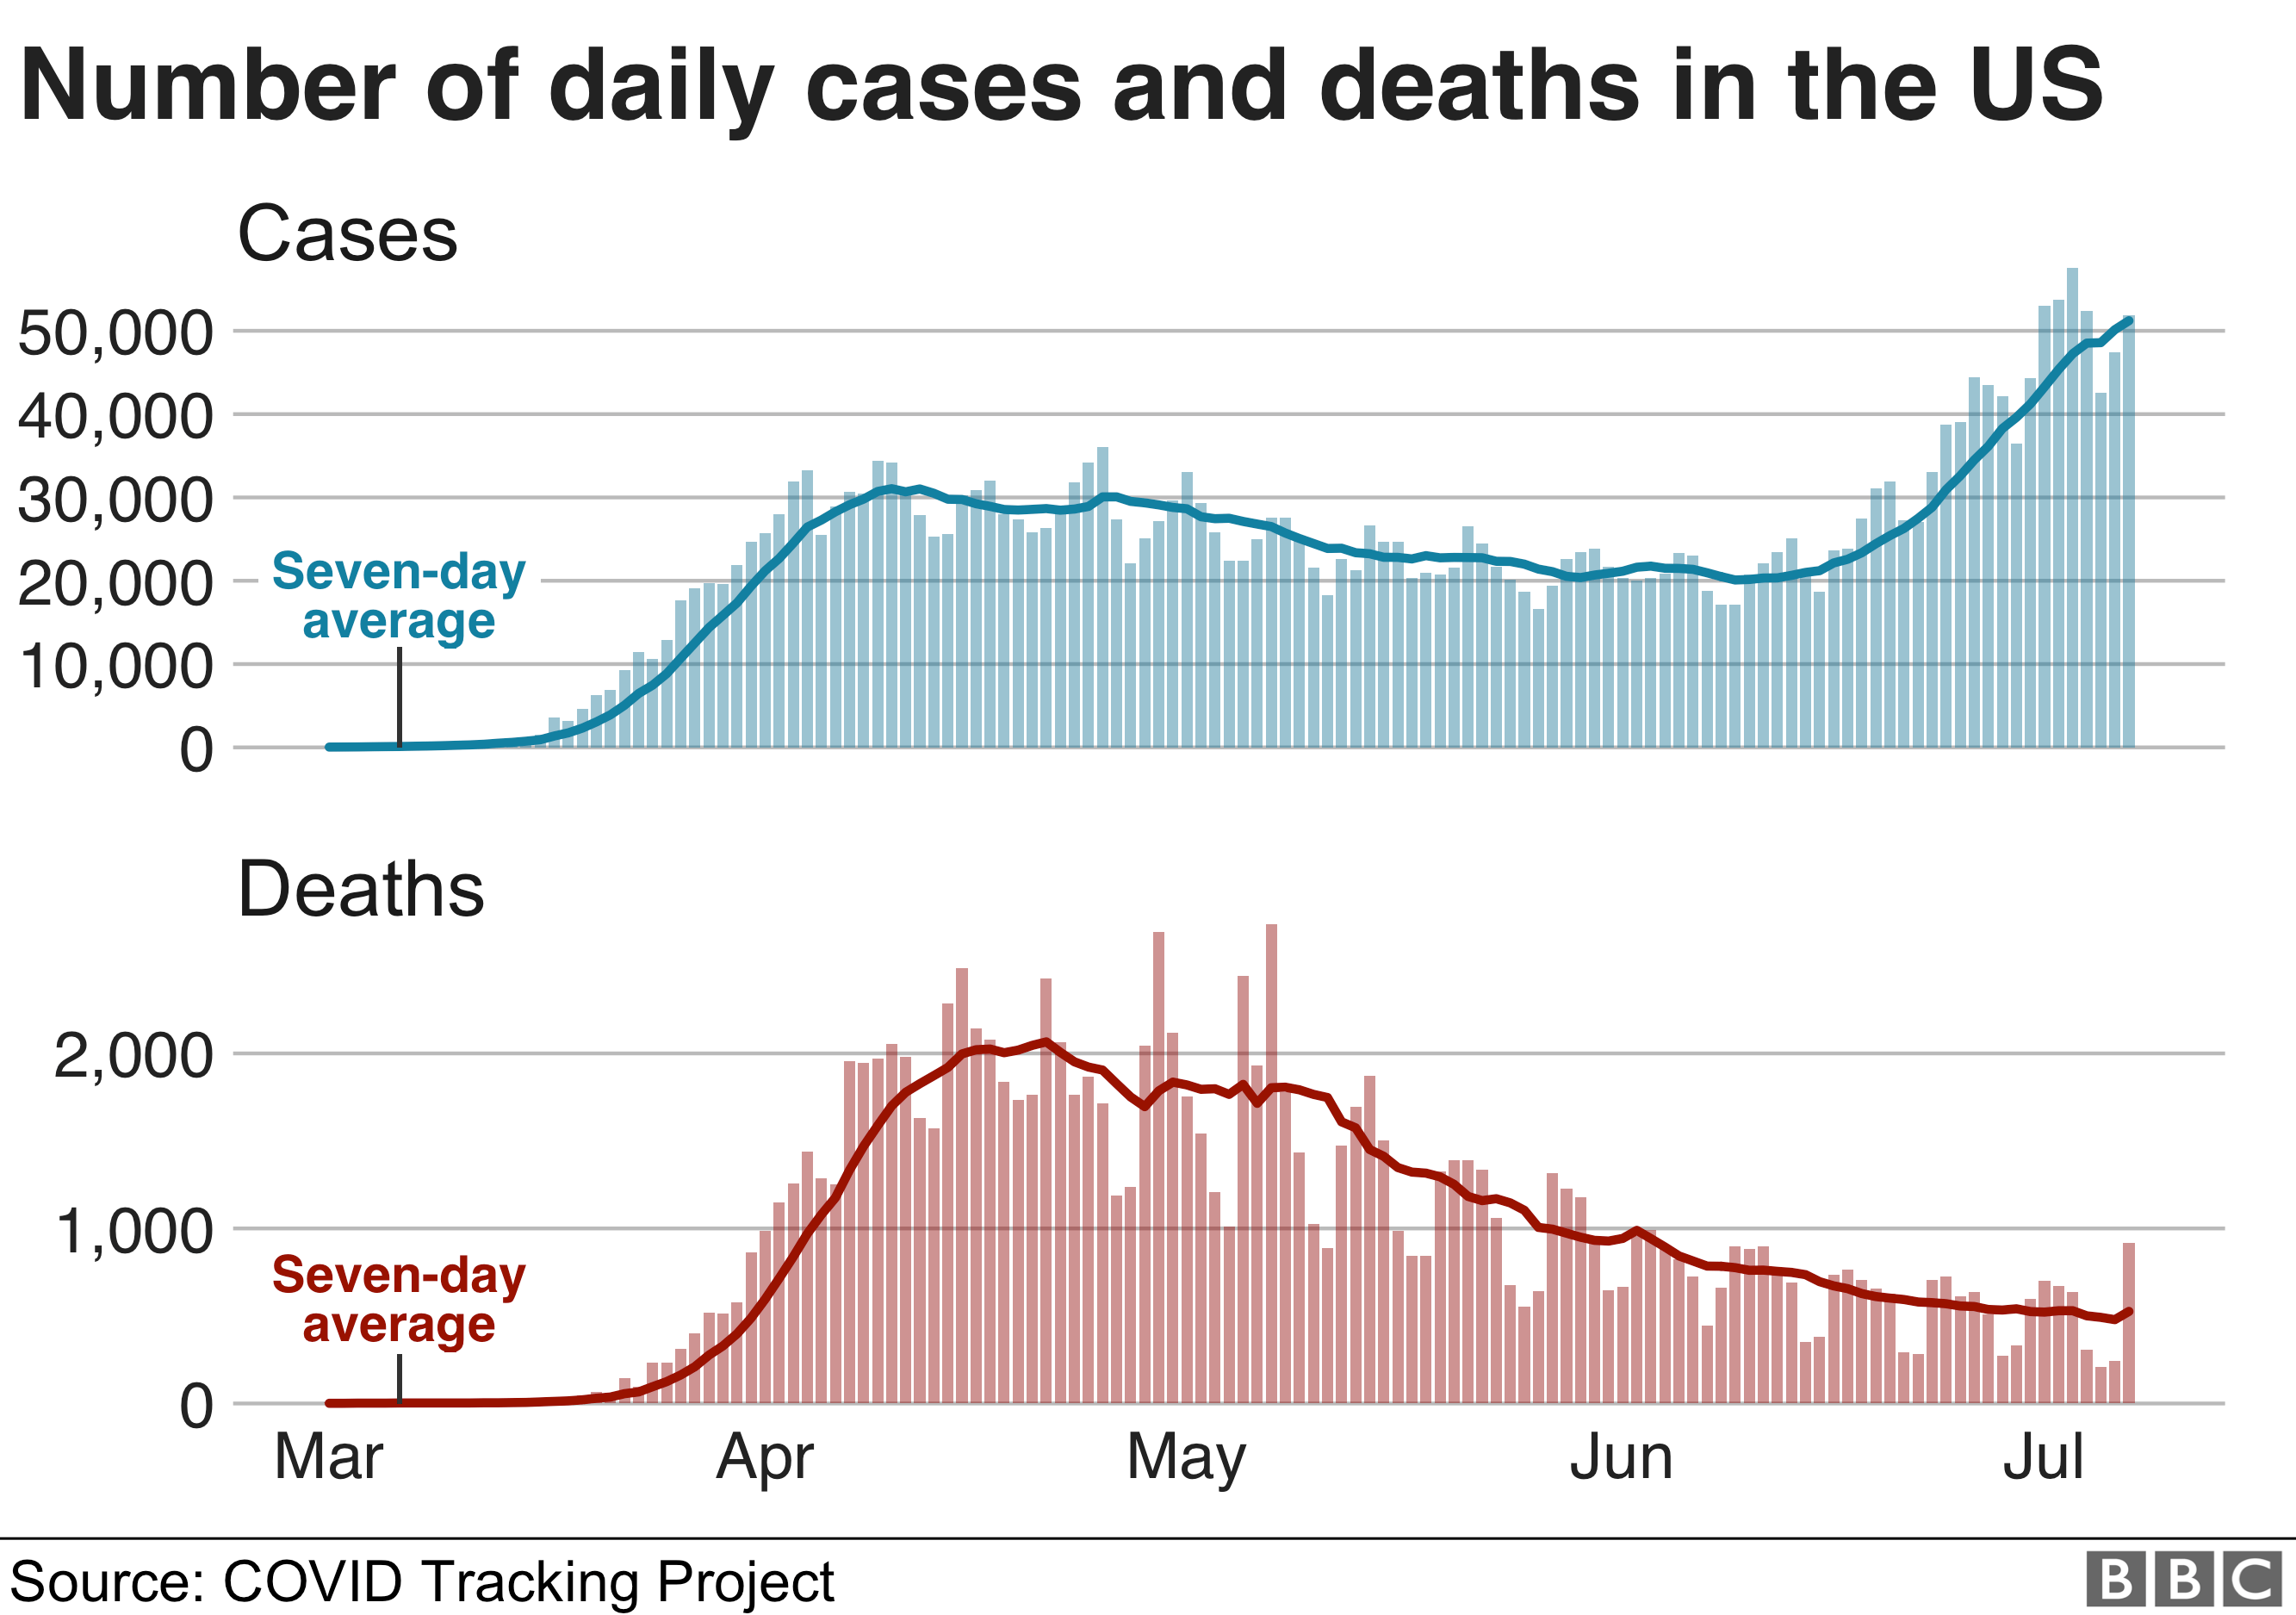
he new case curve has decoupled from the new death cases, overshooting it by a factor of 4+:"
We have
today is:
-deaths rising, but still less than half the death levels from the high plateaus,
-case numbers over twice those from the high plateaus,
>>> hence the factor of 4 in the change in proportionality between the data sets. That is a very large fundamental shift in the data.
I don't have a premium membership so I can't post graphs generated with the very latest data, I've done a search where those two charts are side by side. Your combined tendency to attribute malice on my part is pretty tiresome.
Basically here is the situation as I see it in the US:
-All the large eastern/northern states with large urban centers have already cycled through and are not likely to bounce back,
and they haven't. Those were the low-hanging fruits: NY/NJ (170), Boston/MA (124), Philly/PA (56), Detroit/MI (64), Chicago/IL (60). All these death curves look like those from W. Europe, late stage bell-shaped.
Numbers in parentheses are deaths per 100k, as tabulated here:
https://www.statista.com/statistics/1109011/coronavirus-covid19-death-rates-us-by-state/-Sun Belt states have not experienced a large number of deaths to date relative to their size: FL (28), TX (20), CA(22) and maybe GA (33). They account for the current bounce. There is a relatively high level of uncertainty about where they will go, for example how far TX (20) will close the gap with on Louisiana (84), or NC(18) with Maryland (57).
None of these states are likely to get sustained ICU shortages like those that hit NY, their vitamin D levels are higher, with heat and humidity a factor, and their nursing home policies are probably not going to be as reckless as those in NY. We'll see how it goes...