Florida asks How High

361 Views | 10 Replies | Last: 2 hrs ago by calpoly
smh
How long do you want to ignore this user?
How High is a trick question, sorry, since slow motion rising sea levels are literally out of control, and nobody cares enough to do anything about it.

reliable long term forecast reads "curse god and die hard"

(freebie?) link..
https://www.washingtonpost.com/climate-environment/interactive/2024/us-south-sea-level-rise-climate-change
Quote:

Since 2010, the sea level at the Fort Pulaski gauge has risen by more than 7 inches, one of the fastest rates in the country, according to a Washington Post analysis of National Oceanic and Atmospheric Administration data for 127 tide gauges.

Similar spikes are affecting the entire U.S. Southeast showing a glimpse of our climate future.. .. ..

Overall, sea levels here rose 7.3 inches between 2010 and 2023; in the previous 30 years, the ocean rose about 3.7 inches.
muting more than 300 handles, turnaround is fair play
Eastern Oregon Bear
How long do you want to ignore this user?
smh said:

How High is a trick question, sorry, since slow motion rising sea levels are literally out of control, and nobody cares enough to do anything about it.

reliable long term forecast reads "curse god and die hard"

(freebie?) link..
https://www.washingtonpost.com/climate-environment/interactive/2024/us-south-sea-level-rise-climate-change
Quote:

Since 2010, the sea level at the Fort Pulaski gauge has risen by more than 7 inches, one of the fastest rates in the country, according to a Washington Post analysis of National Oceanic and Atmospheric Administration data for 127 tide gauges.

Similar spikes are affecting the entire U.S. Southeast showing a glimpse of our climate future.. .. ..

Overall, sea levels here rose 7.3 inches between 2010 and 2023; in the previous 30 years, the ocean rose about 3.7 inches.

Hey, it's all the natural cycles of nature. Besides, what's 7 inches when our rights of unlimited driving and electrical power might get limited?
smh
How long do you want to ignore this user?
Quote:

> Hey, it's all the natural cycles of nature. Besides, what's 7 inches when our rights of unlimited driving and electrical power might get limited?
riight, though the many dozen foot follow-on, some years later, may be more inconvenient to locals.
muting more than 300 handles, turnaround is fair play
Eastern Oregon Bear
How long do you want to ignore this user?
smh said:

Quote:

> Hey, it's all the natural cycles of nature. Besides, what's 7 inches when our rights of unlimited driving and electrical power might get limited?
riight, though the many dozen foot follow-on, some years later, may be more inconvenient to locals.

When I arrived at my current workplace, I had been hired to replace a man who had died unexpected at a fairly young age. The office planted a memorial tree in his name on the office grounds. Unfortunately, they didn't provide any support for it while it was a young and growing tree. Today it looks like the one in your picture (our office is in an exposed and windy location) and is about 1/3 the size of trees of the same variety elsewhere around the office. It's really rather sad.
bearister
How long do you want to ignore this user?
smh said:

How High is a trick question…


-George Thorogood
Cancel my subscription to the Resurrection
Send my credentials to the House of Detention
I got some friends inside
Cal88
How long do you want to ignore this user?
smh said:

How High is a trick question, sorry, since slow motion rising sea levels are literally out of control, and nobody cares enough to do anything about it.

reliable long term forecast reads "curse god and die hard"

(freebie?) link..
https://www.washingtonpost.com/climate-environment/interactive/2024/us-south-sea-level-rise-climate-change
Quote:

Since 2010, the sea level at the Fort Pulaski gauge has risen by more than 7 inches, one of the fastest rates in the country, according to a Washington Post analysis of National Oceanic and Atmospheric Administration data for 127 tide gauges.

Similar spikes are affecting the entire U.S. Southeast showing a glimpse of our climate future.. .. ..

Overall, sea levels here rose 7.3 inches between 2010 and 2023; in the previous 30 years, the ocean rose about 3.7 inches.


This is a good example of the manipulative nature of MSM global warming reporting.

I looked up the data this whole article is based on, the tidal gauge measurements of a station located in a Georgia shore, Fort Pulaski, here it is:


https://tidesandcurrents.noaa.gov/sltrends/sltrends_station.shtml?id=8670870

The graph shows that the increase in sea level rise rate from 2010-2024 is well within the historical range of variation. For instance 1988-96 was an even larger rise.

The graph also shows that sea level at that site actually declined between 1996 and 2010, and of course CO2 rise has noting to do with that, it is mainly due to statistical noise that comes with the territory of trying to record tidal gauges in millimeters in areas where the daily tidal differential is around 4 feet (1,300mm roughly).

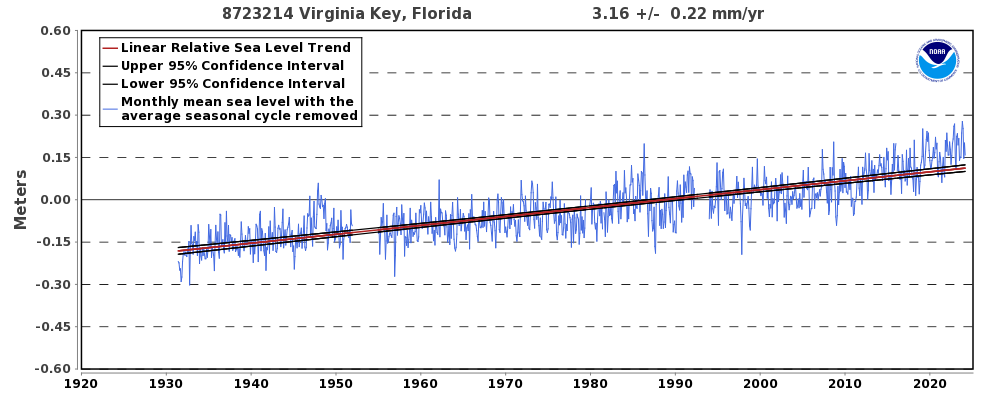
Tidal gages that are older than the one featured in the WP indicate even more clearly that the current rise is well within historical norms of constant, linear increase in sea levels:


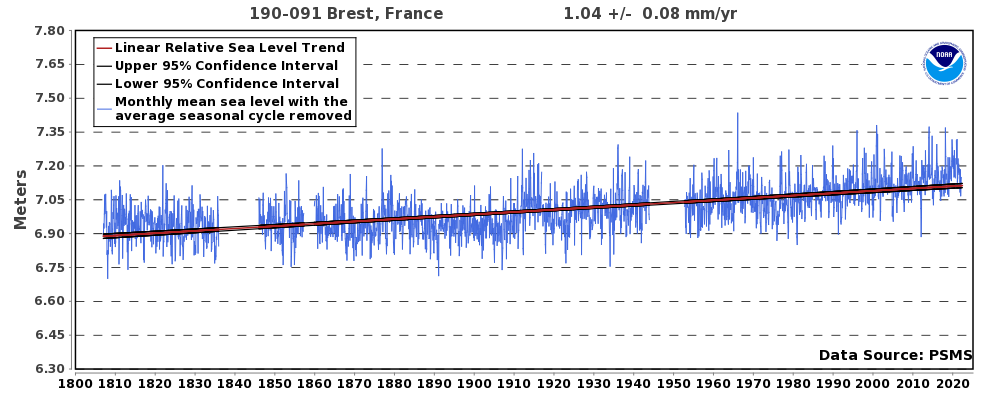
You can go even older using tidal gauges that have recorded measurements that are over 200 years old and see further evidence of the linear and unchanging nature of the rise in sea level, here they are:


NYC


Brest, France (oldest tidal gauge measurements)

Those measurements, once again, confirm that the rate of rise in sea levels is:

1- nearly constant, unchanging since the early 1800s.

2- very low, about an inch per decade.
concordtom
How long do you want to ignore this user?
What kind of MPG do you get?
Cal88
How long do you want to ignore this user?
Around 35MPG.
dimitrig
How long do you want to ignore this user?
Cal88 said:

smh said:

How High is a trick question, sorry, since slow motion rising sea levels are literally out of control, and nobody cares enough to do anything about it.

reliable long term forecast reads "curse god and die hard"

(freebie?) link..
https://www.washingtonpost.com/climate-environment/interactive/2024/us-south-sea-level-rise-climate-change
Quote:

Since 2010, the sea level at the Fort Pulaski gauge has risen by more than 7 inches, one of the fastest rates in the country, according to a Washington Post analysis of National Oceanic and Atmospheric Administration data for 127 tide gauges.

Similar spikes are affecting the entire U.S. Southeast showing a glimpse of our climate future.. .. ..

Overall, sea levels here rose 7.3 inches between 2010 and 2023; in the previous 30 years, the ocean rose about 3.7 inches.


This is a good example of the manipulative nature of MSM global warming reporting.

I looked up the data this whole article is based on, the tidal gauge measurements of a station located in a Georgia shore, Fort Pulaski, here it is:


https://tidesandcurrents.noaa.gov/sltrends/sltrends_station.shtml?id=8670870

The graph shows that the increase in sea level rise rate from 2010-2024 is well within the historical range of variation. For instance 1988-96 was an even larger rise.

The graph also shows that sea level at that site actually declined between 1996 and 2010, and of course CO2 rise has noting to do with that, it is mainly due to statistical noise that comes with the territory of trying to record tidal gauges in millimeters in areas where the daily tidal differential is around 4 feet (1,300mm roughly).

Tidal gages that are older than the one featured in the WP indicate even more clearly that the current rise is well within historical norms of constant, linear increase in sea levels:


You can go even older using tidal gauges that have recorded measurements that are over 200 years old and see further evidence of the linear and unchanging nature of the rise in sea level, here they are:


NYC


Brest, France (oldest tidal gauge measurements)

Those measurements, once again, confirm that the rate of rise in sea levels is:

1- nearly constant, unchanging since the early 1800s.

2- very low, about an inch per decade.


" The annual rate of rise or how quickly sea level rise is happening has also increased from 0.08 inches/year (0.20 centimeters/year) in 1993 to the current yearly rate of 0.17 inches/year (0.44 centimeters/year)."


Link:
https://sealevel.nasa.gov/understanding-sea-level/key-indicators/global-mean-sea-level/
Eastern Oregon Bear
How long do you want to ignore this user?
dimitrig said:

Cal88 said:

smh said:

How High is a trick question, sorry, since slow motion rising sea levels are literally out of control, and nobody cares enough to do anything about it.

reliable long term forecast reads "curse god and die hard"

(freebie?) link..
https://www.washingtonpost.com/climate-environment/interactive/2024/us-south-sea-level-rise-climate-change
Quote:

Since 2010, the sea level at the Fort Pulaski gauge has risen by more than 7 inches, one of the fastest rates in the country, according to a Washington Post analysis of National Oceanic and Atmospheric Administration data for 127 tide gauges.

Similar spikes are affecting the entire U.S. Southeast showing a glimpse of our climate future.. .. ..

Overall, sea levels here rose 7.3 inches between 2010 and 2023; in the previous 30 years, the ocean rose about 3.7 inches.


This is a good example of the manipulative nature of MSM global warming reporting.

I looked up the data this whole article is based on, the tidal gauge measurements of a station located in a Georgia shore, Fort Pulaski, here it is:


https://tidesandcurrents.noaa.gov/sltrends/sltrends_station.shtml?id=8670870

The graph shows that the increase in sea level rise rate from 2010-2024 is well within the historical range of variation. For instance 1988-96 was an even larger rise.

The graph also shows that sea level at that site actually declined between 1996 and 2010, and of course CO2 rise has noting to do with that, it is mainly due to statistical noise that comes with the territory of trying to record tidal gauges in millimeters in areas where the daily tidal differential is around 4 feet (1,300mm roughly).

Tidal gages that are older than the one featured in the WP indicate even more clearly that the current rise is well within historical norms of constant, linear increase in sea levels:


You can go even older using tidal gauges that have recorded measurements that are over 200 years old and see further evidence of the linear and unchanging nature of the rise in sea level, here they are:


NYC


Brest, France (oldest tidal gauge measurements)

Those measurements, once again, confirm that the rate of rise in sea levels is:

1- nearly constant, unchanging since the early 1800s.

2- very low, about an inch per decade.


" The annual rate of rise or how quickly sea level rise is happening has also increased from 0.08 inches/year (0.20 centimeters/year) in 1993 to the current yearly rate of 0.17 inches/year (0.44 centimeters/year)."


Link:
https://sealevel.nasa.gov/understanding-sea-level/key-indicators/global-mean-sea-level/

It's comical how he cherry picks time periods to try and disprove what is obvious to the naked eye. 2010 was a relatively high outlier and comparing 2010 to now is misleading and intellectually dishonest. Also, 1988 was a relatively low point and 1996 was a relative high point, so claiming the slope was higher then than now is meaningless. With the possible exception of The Battery in NYC, the rate of rise has been increasing since 1990 or so on the plots he cherry picked. The fact that it's increasing at all is an indication that some coastal land areas are in the process of getting inundated. Quibbling about the rate of increase doesn't mean sea level rise isn't happening.
calpoly
How long do you want to ignore this user?
Eastern Oregon Bear said:

dimitrig said:

Cal88 said:

smh said:

How High is a trick question, sorry, since slow motion rising sea levels are literally out of control, and nobody cares enough to do anything about it.

reliable long term forecast reads "curse god and die hard"

(freebie?) link..
https://www.washingtonpost.com/climate-environment/interactive/2024/us-south-sea-level-rise-climate-change
Quote:

Since 2010, the sea level at the Fort Pulaski gauge has risen by more than 7 inches, one of the fastest rates in the country, according to a Washington Post analysis of National Oceanic and Atmospheric Administration data for 127 tide gauges.

Similar spikes are affecting the entire U.S. Southeast showing a glimpse of our climate future.. .. ..

Overall, sea levels here rose 7.3 inches between 2010 and 2023; in the previous 30 years, the ocean rose about 3.7 inches.


This is a good example of the manipulative nature of MSM global warming reporting.

I looked up the data this whole article is based on, the tidal gauge measurements of a station located in a Georgia shore, Fort Pulaski, here it is:


https://tidesandcurrents.noaa.gov/sltrends/sltrends_station.shtml?id=8670870

The graph shows that the increase in sea level rise rate from 2010-2024 is well within the historical range of variation. For instance 1988-96 was an even larger rise.

The graph also shows that sea level at that site actually declined between 1996 and 2010, and of course CO2 rise has noting to do with that, it is mainly due to statistical noise that comes with the territory of trying to record tidal gauges in millimeters in areas where the daily tidal differential is around 4 feet (1,300mm roughly).

Tidal gages that are older than the one featured in the WP indicate even more clearly that the current rise is well within historical norms of constant, linear increase in sea levels:


You can go even older using tidal gauges that have recorded measurements that are over 200 years old and see further evidence of the linear and unchanging nature of the rise in sea level, here they are:


NYC


Brest, France (oldest tidal gauge measurements)

Those measurements, once again, confirm that the rate of rise in sea levels is:

1- nearly constant, unchanging since the early 1800s.

2- very low, about an inch per decade.


" The annual rate of rise or how quickly sea level rise is happening has also increased from 0.08 inches/year (0.20 centimeters/year) in 1993 to the current yearly rate of 0.17 inches/year (0.44 centimeters/year)."


Link:
https://sealevel.nasa.gov/understanding-sea-level/key-indicators/global-mean-sea-level/

It's comical how he cherry picks time periods to try and disprove what is obvious to the naked eye. 2010 was a relatively high outlier and comparing 2010 to now is misleading and intellectually dishonest. Also, 1988 was a relatively low point and 1996 was a relative high point, so claiming the slope was higher then than now is meaningless. With the possible exception of The Battery in NYC, the rate of rise has been increasing since 1990 or so on the plots he cherry picked. The fact that it's increasing at all is an indication that some coastal land areas are in the process of getting inundated. Quibbling about the rate of increase doesn't mean sea level rise isn't happening.
88 has been showing the same crap for years.
Refresh
Page 1 of 1
 
×
subscribe Verify your student status
See Subscription Benefits
Trial only available to users who have never subscribed or participated in a previous trial.