


That picture of Joe Roth brings back those memories. Bittersweet for sure.
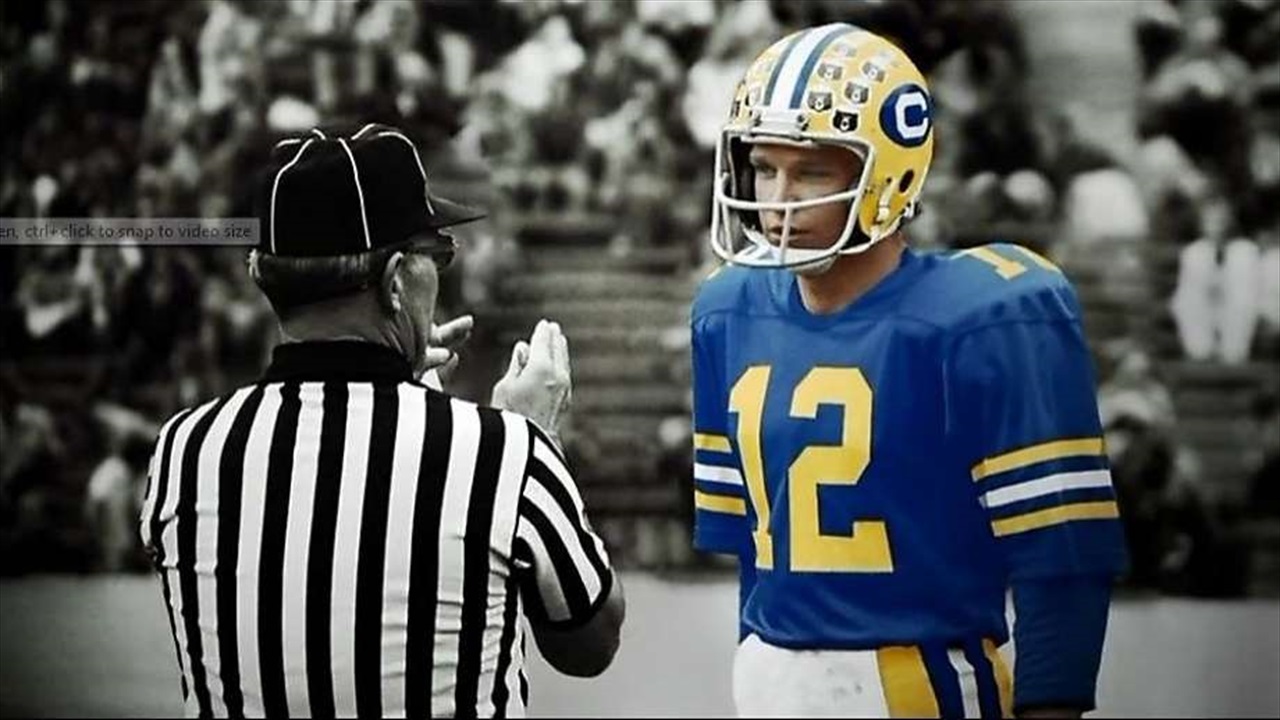
Photo by Don't Quit: The Joe Roth Story
Generally most people working with historical college football stats/history consider the age of modern college football to have begun in 1937. I’m not sure why this is so, but it probably has something to do with The Great Depression and its impact on college football.
In any event, over the years I’ve collected a lot of college football data from various Internet sites, some of which are no longer available on the Internet. Also, I discovered that some data was incomplete (eg. complete passing stats) or just wrong. An example of wrong data would be the NCAA contention that two-platoon football was reinstated for the 1965 season. That’s flat out wrong. My senior season was 1964 and we played two-platoon football that year because unlimited substitution was reinstated after the 1963 season. Also, many of the stats prior to the 1970s did not include bowl game stats. However, there was only 4-5 bowls during this period which means the exclusion of bowl data in the overall scheme of things is negligible since there were 700-1000 regular season games back then.
Despite the above-mentioned short-comings I believe the following table portrays a fairly accurate statistical history of major college football. You can see the impact of WWII and the Korean War on rules changes, stats, and freshman eligibility. However, the most significant change is in the continuing improvement in the efficiency of the passing game, particularly in the TD/Int ratio. By comparison, the rushing game (both in Ypg and Ypc) has changed very little over the past 60-80 years.
I don’t know how to quantify it, but it would be very interesting to see which of the following were most responsible for the significant improvement in passing stats: (a) Rules Changes, (b) Formation Changes, (c) Player Experience, (d) Coaching Ingenuity, etc.
1937 to 2017 - NCAA Football Analysis
Never miss the latest news from Bear Insider!
Join our free email list