UrsusArctosCalifornicus said:
Anyway...well, progression curve may be a more accurate & revealing indicator than static times of how our Bears are shaping up early into the season - but at any rate, thought I'd just throw in some Sept-Oct stats for the past 2 seasons for a quick comparison, FWIW.
At this point for both years, only 3 meets have been raced - Queen of the Pool, Fresno State Invite & v. Utah.
Won't be factoring in the one-off special that was the 2017 USA College Challenge competed by just a select few who were suited up anyway.
====
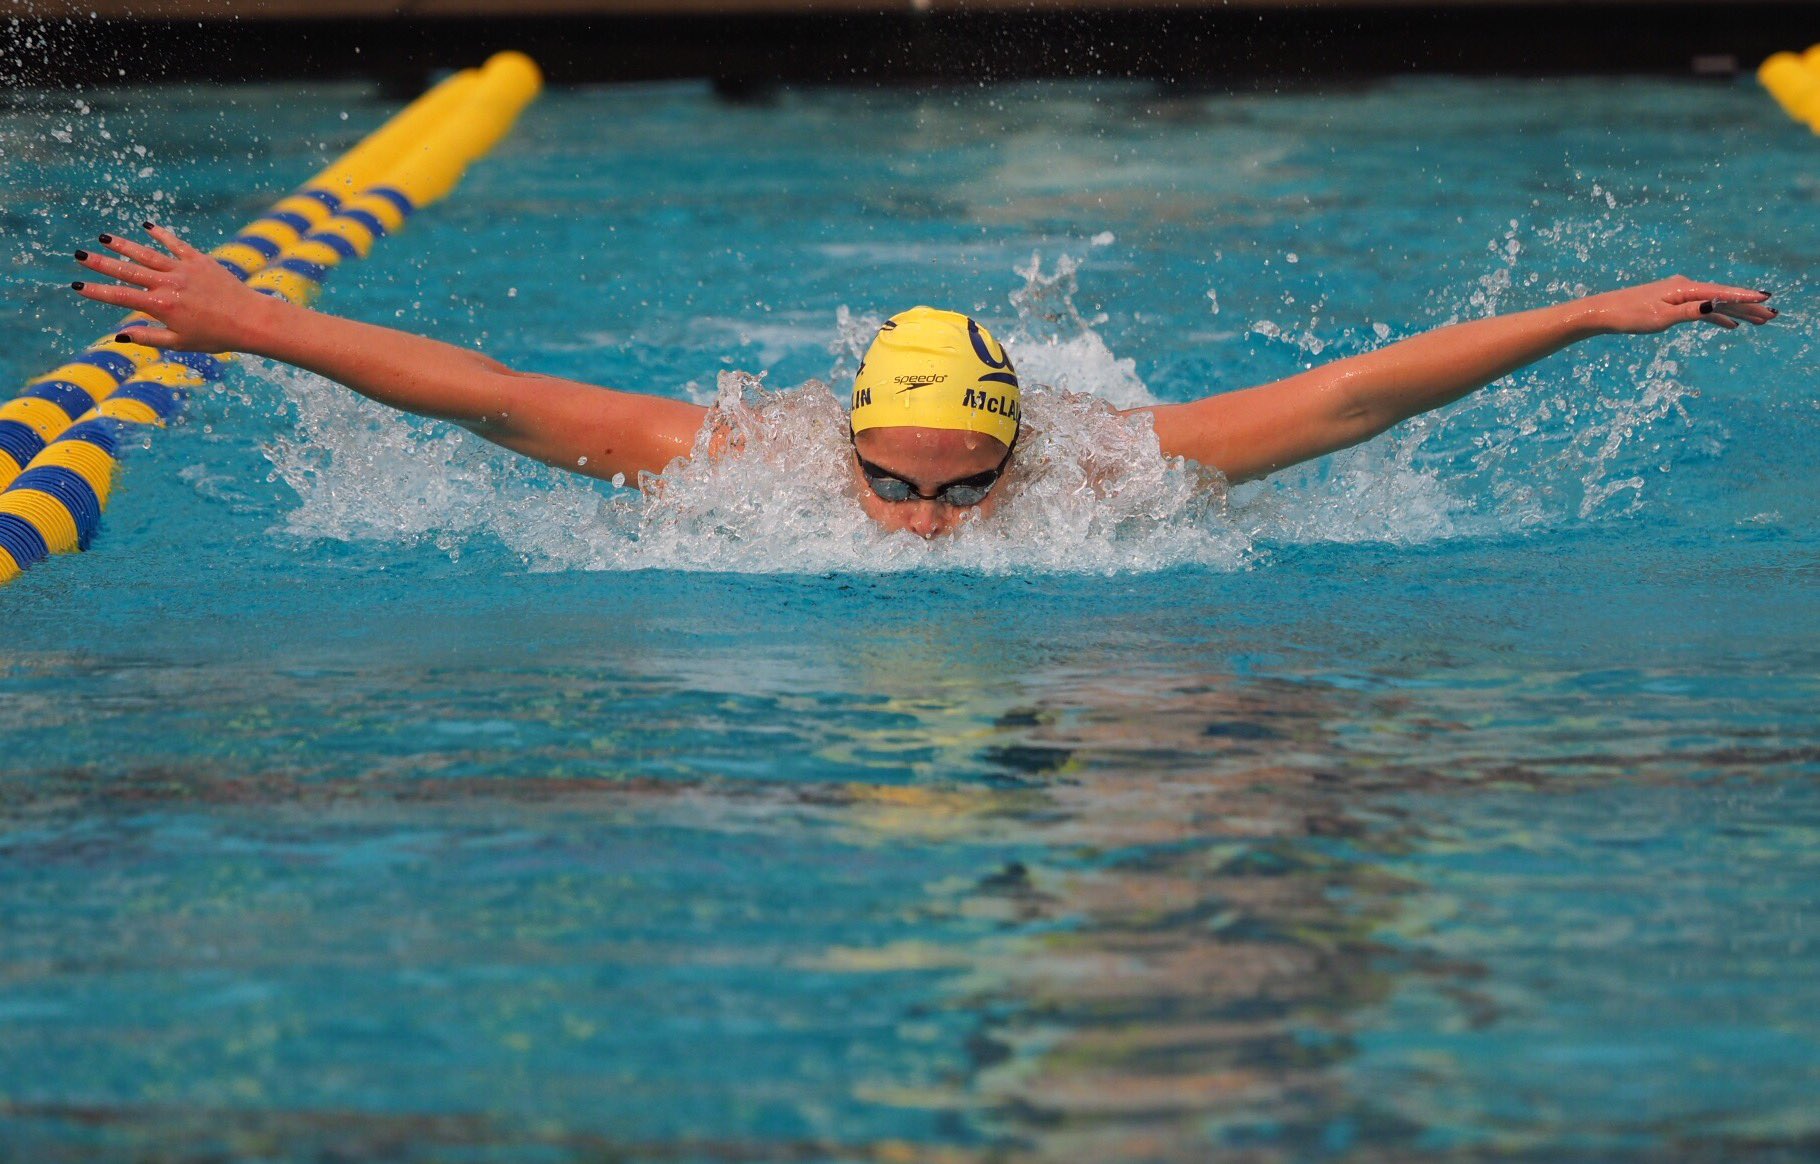
*Katie* (Oct 2017 | 2018)
100 Free: 50.88 | 48.79
50 Free: 24.12 | 22.71
100 Fly: 54.82 | 53.62
====
*Abbey* (Oct 2017 | 2018)
100 Breast: 1:04.81 | 1:01.92
100 Free: 50.61 | 48.78
100 Fly: 55.85 | 54.89
====
*Sarah* (Oct 2017 | 2018)
200 IM: 2:00.96 | 2:00.72
400 IM: 4:15.56 | 4:15.32
200 Free: 1:51.70r | 1:49.50
200 Fly: 2:02.53 | 2:01.06
200 Breast: 2:18.33 | 2:19.70
====
Interestingly enough,
SwimSwam has published their massively more thorough & detailed analysis of Oct times this season v. last year's (for Division I swimmers, both women & men), and I have included an excerpt below from their comprehensive writeup below for your reference.
One thing to keep in mind - as mentioned in my quoted post, the College Challenge last year does mess things up a bit, since it was a high profile
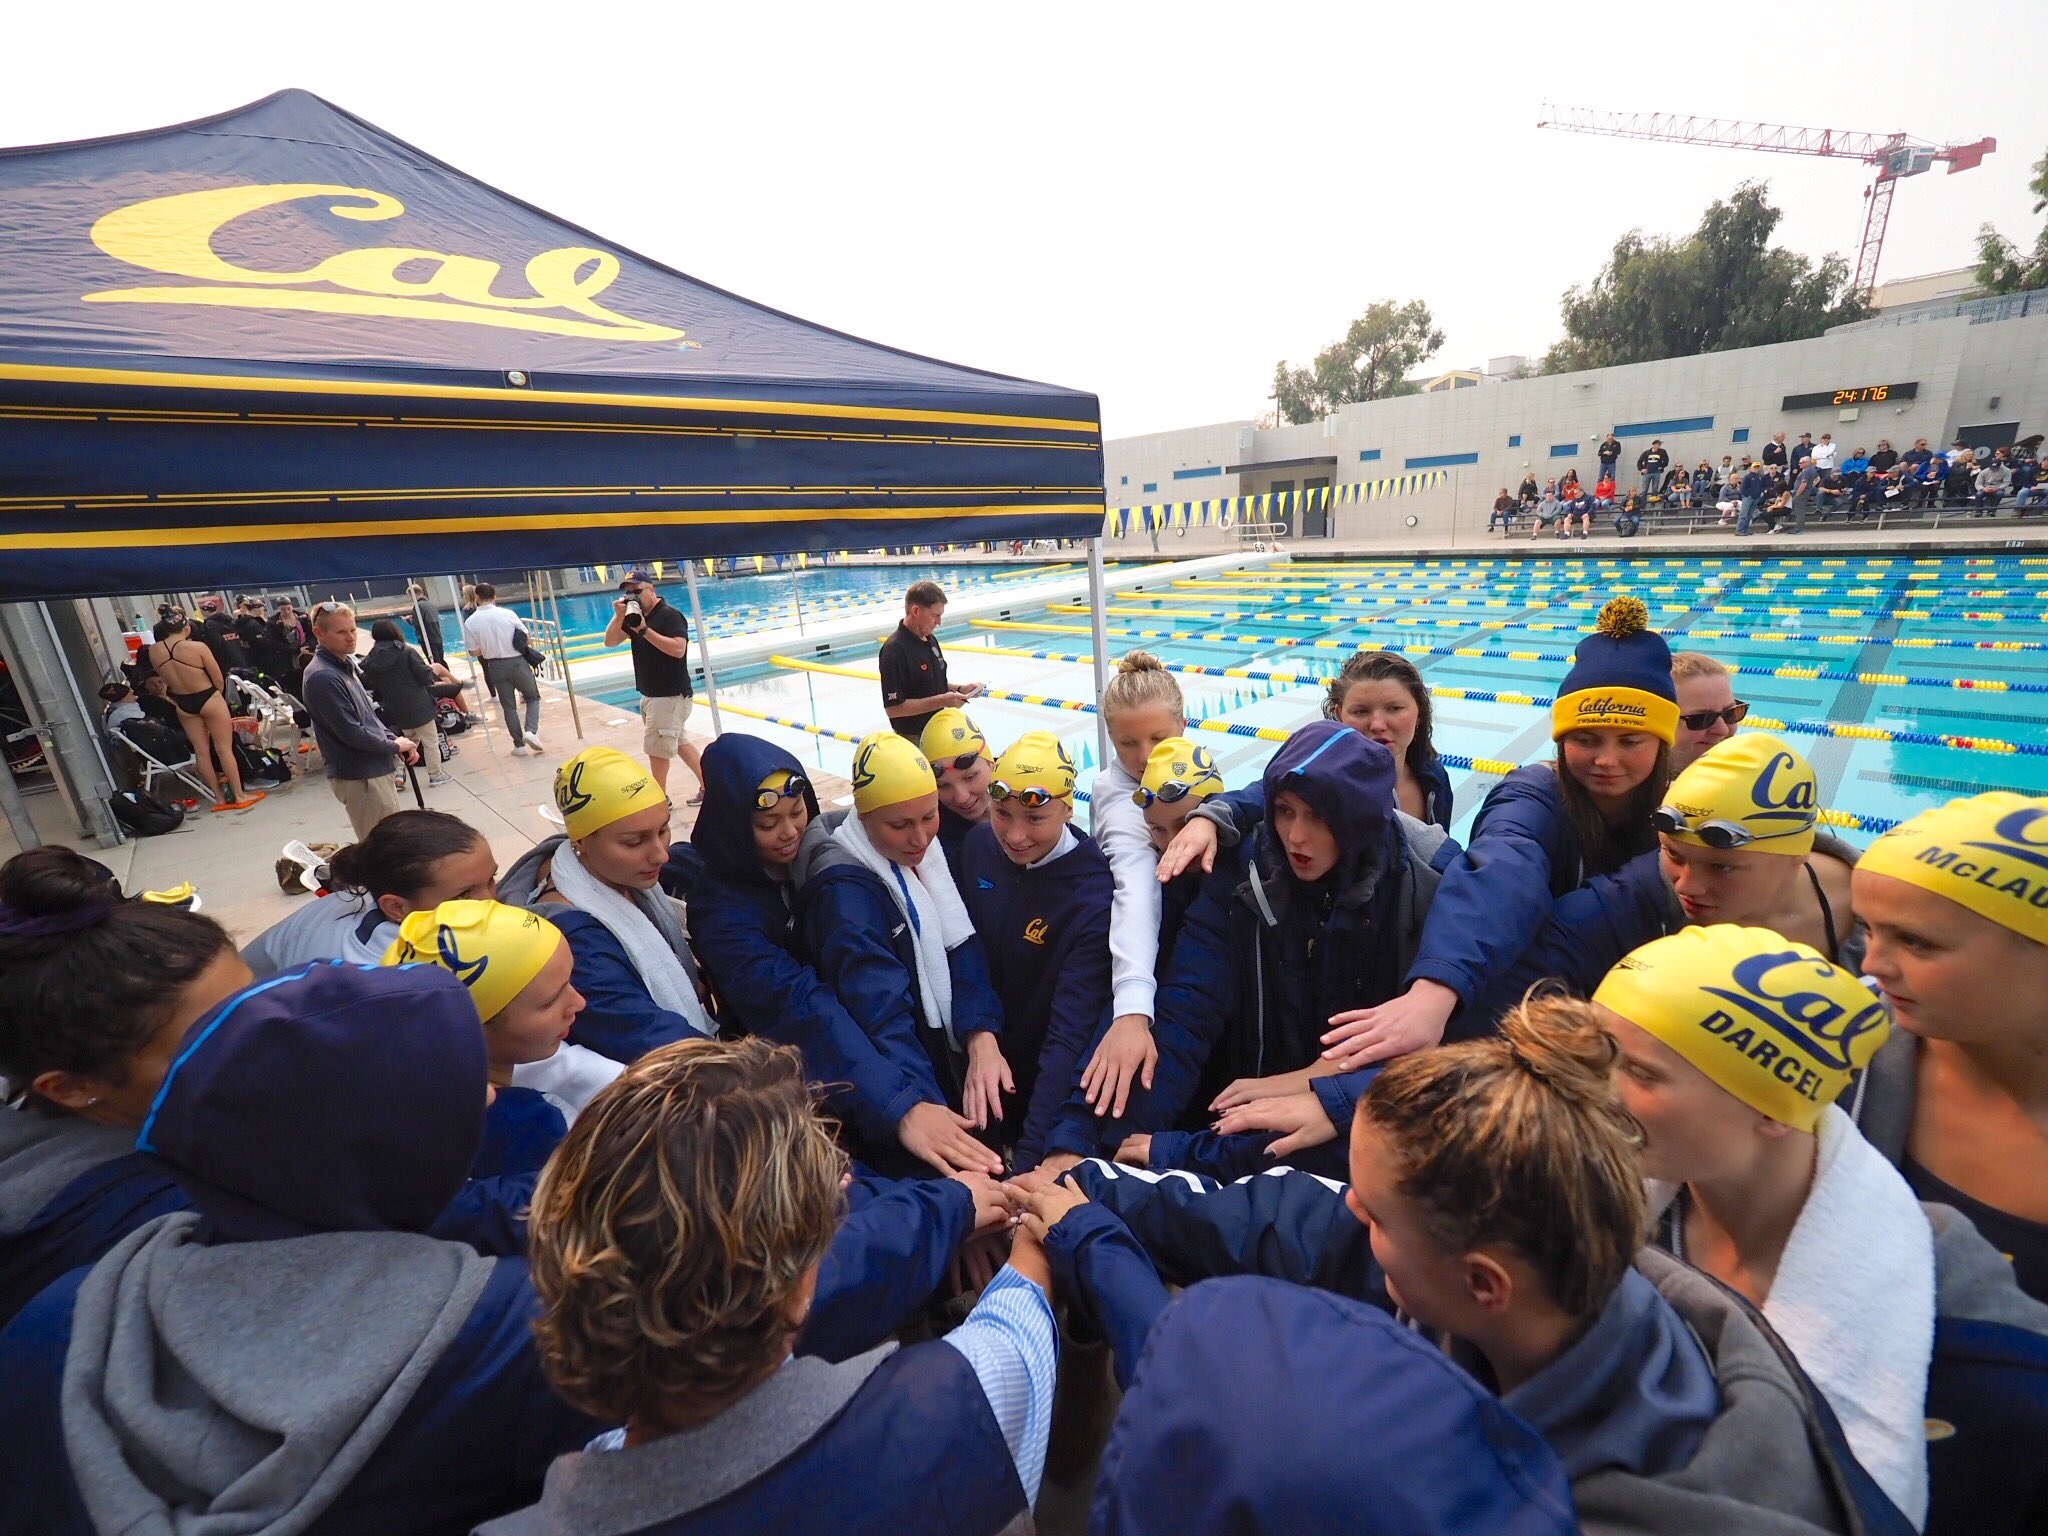
suited meet early in the season that some of our women were invited to (Abbey, Bug, Thleen, Madds, Robin), whilst Bears haven't competed in a suited meet at this point into the 2018 season.
Contrast that with the Trojanettes who have already raced all suited up TWICE so far this year, with Louisville & Virginia amongst the top contenders who have also participated in a suited competition this Oct.
Hence SwimSwam's comparison shows both
Katie &
Abbey as swimming slower in Oct 2018, whereas
Sarah is listed as being faster (our fave Canadian presently on the team wasn't involved in the 2017 College Challenge)
Lest any of us here may get a mite hopeful over this year's apparently slower times for the Furdette Juggernaut in general

, let's bear in mind that a sizeable contingent of trees were also represented at the 2017 USA College Challenge (suited meet), and like Bears, LSJU hasn't suited up thus far in the current season...
Another important consideration is that the frosh class isn't factored in here, this season being their very first year repping their respective college programmes.
-------
NCAA OCTOBER PERFORMANCE: WHO IS FASTER SO FAR?BY ANDREW MERING | November 01st, 2018October has come to a close, so we now have all of the October times data from this season that we're going to get. So, who is looking fast? Who is off their game? Let's dive into the data.
I looked at every D1 swimmer who had a time in an event last October, this October, and at their conference meet or nationals last year. I then compared their fastest October times from each year in those events. The conference/nationals requirement is to make sure that these are primary events for swimmers and not something they are doing for fun/experience or at a pentathlon meet or something.
The team level data is where things get really interesting. That can give us some insight into how tired teams are and how well they've actually been swimming.
Suiting for early season meets appears to be the explanation for a good chunk of the teams with large early season time differences. Among power conference women's teams, the best performers have been Virginia (1.4% faster, 34 swims) and USC (1.2% faster, 32). This is at least in part because of their participation in the
SMU Classic. Swimmers at that meet
were suited and the competition is fast. Due to the entry limit, may of the swimmers that participated for USC this year weren't there last year explaining their improvement. Also,
USC suited for the Trojan Invite this year.
In the case of Virginia, they weren't at SMU last year, so everyone who participated for them didn't have a suited meet in October last year. For two of last year's SMU participants, the Michigan women (1.7% slower, 21) and the UCLA women (2.5% slower, 14), their non participation this year likely can go a long way toward explaining their slower average performances this year-both are in the bottom 5 women's teams.
TEAM OCTOBER TIME CHANGE AVERAGEnegative is faster, positive is slower, Comparing swimmers to themselves. Best time in the month of October this year and last year. Only in events they swam at end of year taper meets. Number is the number of data points for each team.
Team | Average Change | NumberVirginia | -1.4% | 34
Southern Cali | -1.2% | 36
Indiana | -0.6% | 26
California | -0.2% | 39
Tennessee | -0.1% | 28
Georgia | -0.1% | 20
Minnesota | 0.1% | 33
Texas | 0.4% | 38
Texas A&M | 0.4% | 28
Louisville | 0.8% | 41
Stanford | 1.5% | 7
Michigan | 1.7% | 21
TOP 10 WOMEN FROM 2018 SEASON OCTOBER TIME CHANGENAME | SCHOOL | EVENT | TAPER TIME | 2017 OCT TIME | 2018 OCT TIME | CHANGEDarcel, Sarah | California | 200 IM | 1:54.5 | 2:00.96 | 2:00.72 | -0.2%
Darcel, Sarah | California | 400 IM | 4:03 | 4:15.56 | 4:15.32 | -0.1%
McLaughlin, Katie | California | 200 Fly | 1:52.64 | 1:55.94 | 1:57.33 | 1.2%
Weitzeil, Abbey | California | 100 Free | 46.63 | 48.04 | 48.78 | 1.5%
Weitzeil, Abbey | California | 50 Free | 21.41 | 21.63 | 22.17 | 2.5%
Eastin, Ella | Stanford | 200 Fly | 1:49.51 | 1:52.83 | 1:56.53 | 3.3%
Drabot, Katie | Stanford | 200 Free | 1:42.99 | 1:44.26 | 1:52.52 | 7.9%
-------