calumnus said:
Cal88 said:
kal kommie said:
Cal88 said:
calumnus said:
CNHTH said:
Cal88 said:
Climate change as an issue has taken a backseat the last few years, it is not nearly as present in the media as it was a few years ago. I think the reason for this is that the decarbonization agenda is completely incompatible with the AI agenda, which consumes a tremendous amount of energy, and accounts today for nearly all the economic growth, in addition to being a very strategic technology.
This being said, the EV revolution and renewables getting cheaper and more accessible (solar and nuclear) mean that we may have already reached peak fossil fuel consumption just through technology and market forces alone (with subsidies as an assist).
Global warming alarmism is becoming a niche cultural/political issue, superseded by the highly turbulent current geopolitical context.
What exactly are you arguing?
That the second and third laws of thermodynamics are invalid?
Good luck with that!
1.)
-earth was 30C in the carbiniforous period due to millions of years of heavy volcanic activity
-those temps allowed planktons to proliferate in warm oceans and remove co2 from the atmosphere
-over 10s of millions of years those planktons formed oil as they were partially subducted.
2.) we're re-releasing that co2 that took tens of millions of years to sequester in a geologic millisecond.
There is a reason the Carboniferous Period is called the Carboniferous Period. The other factor was plant life moving to the land ahead of animal life that could consume them. Giant tree ferns, etc. produced so much oxygen that insects could grow to huge size and when the plants died and were buried under successive growth they captured huge amounts of carbon that has only been released in the last 150 years by digging up and burning those fossil fuels.
It is amazing that we have a pretty good understanding of the atmospheres of other planets and moons in our solar system, now even planets in far distant solar systems, but there are people who discount our FAR greater understanding of our own atmosphere and geologic history.
The issue here is you haven't heard the scientific argument putting the current situation in context, such as:
- the effect of higher CO2 levels on global agricultural output and the ongoing greening of the earth
- the logarithmic, not linear relationship between increased CO2 concentration and temperature increase from the greenhouse effect
- the observed lack of acceleration of sea level rise from dozens of tidal gauges across the world, directly contradicting alarmist predictions of accelerating sea level rise
- the current CO2 levels are, on a geological scale, close to the lowest they have been in the last billion year.
1. The uncertain extent of enhanced agricultural output from higher C02 levels and the greening of some northern latitude regions doesn't offset the more certain loss of agricultural output and habitability in adversely affected regions. It doesn't reassure the billions of people who live in areas threatened by drought and desertification in subtropical regions that Greenland, Siberia and the Yukon may become much more habitable.
There is nothing uncertain about the relationship between CO2 levels and agricultural output. It is a most elementary aspect of photosynthesis. Yield curves for every plant class have been established. The first thing a commercial greenhouse plant operator will do is to pump CO2 to 2-4 times atmospheric levels, boosting output by as much as 100%.
https://www.hortidaily.com/article/9674492/co2-enrichment-can-lead-to-increased-yields-from-40-to-100-in-plants-like-tomatoes/
As well plants respond much more to higher CO2 levels in arid climates, as plants need less water to grow the higher the CO2 levels, because they will have fewer stomata and will exhale less water in the process of capturing atmospheric CO2.
Quote:
CO2 boosts plant productivity
Plants use sunlight, carbon dioxide from the atmosphere, and water for photosynthesis to produce oxygen and carbohydrates that plants use for energy and growth.
Rising levels of CO2 in the atmosphere drive an increase in plant photosynthesisan effect known as the carbon fertilization effect. New research has found that between 1982 and 2020, global plant photosynthesis grew 12 percent, tracking CO2 levels in the atmosphere as they rose 17 percent. The vast majority of this increase in photosynthesis was due to carbon dioxide fertilization.
Increased photosynthesis results in more growth in some plants. Scientists have found that in response to elevated CO2 levels, above-ground plant growth increased an average of 21 percent, while below-ground growth increased 28 percent. As a result, some crops such as wheat, rice and soybeans are expected to benefit from increased CO2 with an increase in yields from 12 to 14 percent.
Under elevated CO2 concentrations, plants use less water during photosynthesis. Plants have openings called stomata that allow CO2 to be absorbed and moisture to be released into the atmosphere. When CO2 levels rise, plants can maintain a high rate of photosynthesis and partially close their stomata, which can decrease a plant's water loss between 5 and 20 percent. Scientists have speculated that this could result in plants releasing less water to the atmosphere, thus keeping more on land, in the soil and streams.
https://news.climate.columbia.edu/2022/01/27/how-climate-change-will-affect-plants
Contrary to your post above, it is not just northern latitudes that are most benefitting from increased CO2, but arid regions like the African Sahel. Over the last several decades, the Sahara Desert has shrunk by over 10%, an area the size of France and Germany combined, largely due to CO2 fertilizing effect greening. As I have described above, the drier the conditions, the more powerful is the CO2 fertilizing effect.
https://theweek.com/environment/sahara-desert-turning-green
https://e360.yale.edu/features/greening-drylands-carbon-dioxide-climate-change
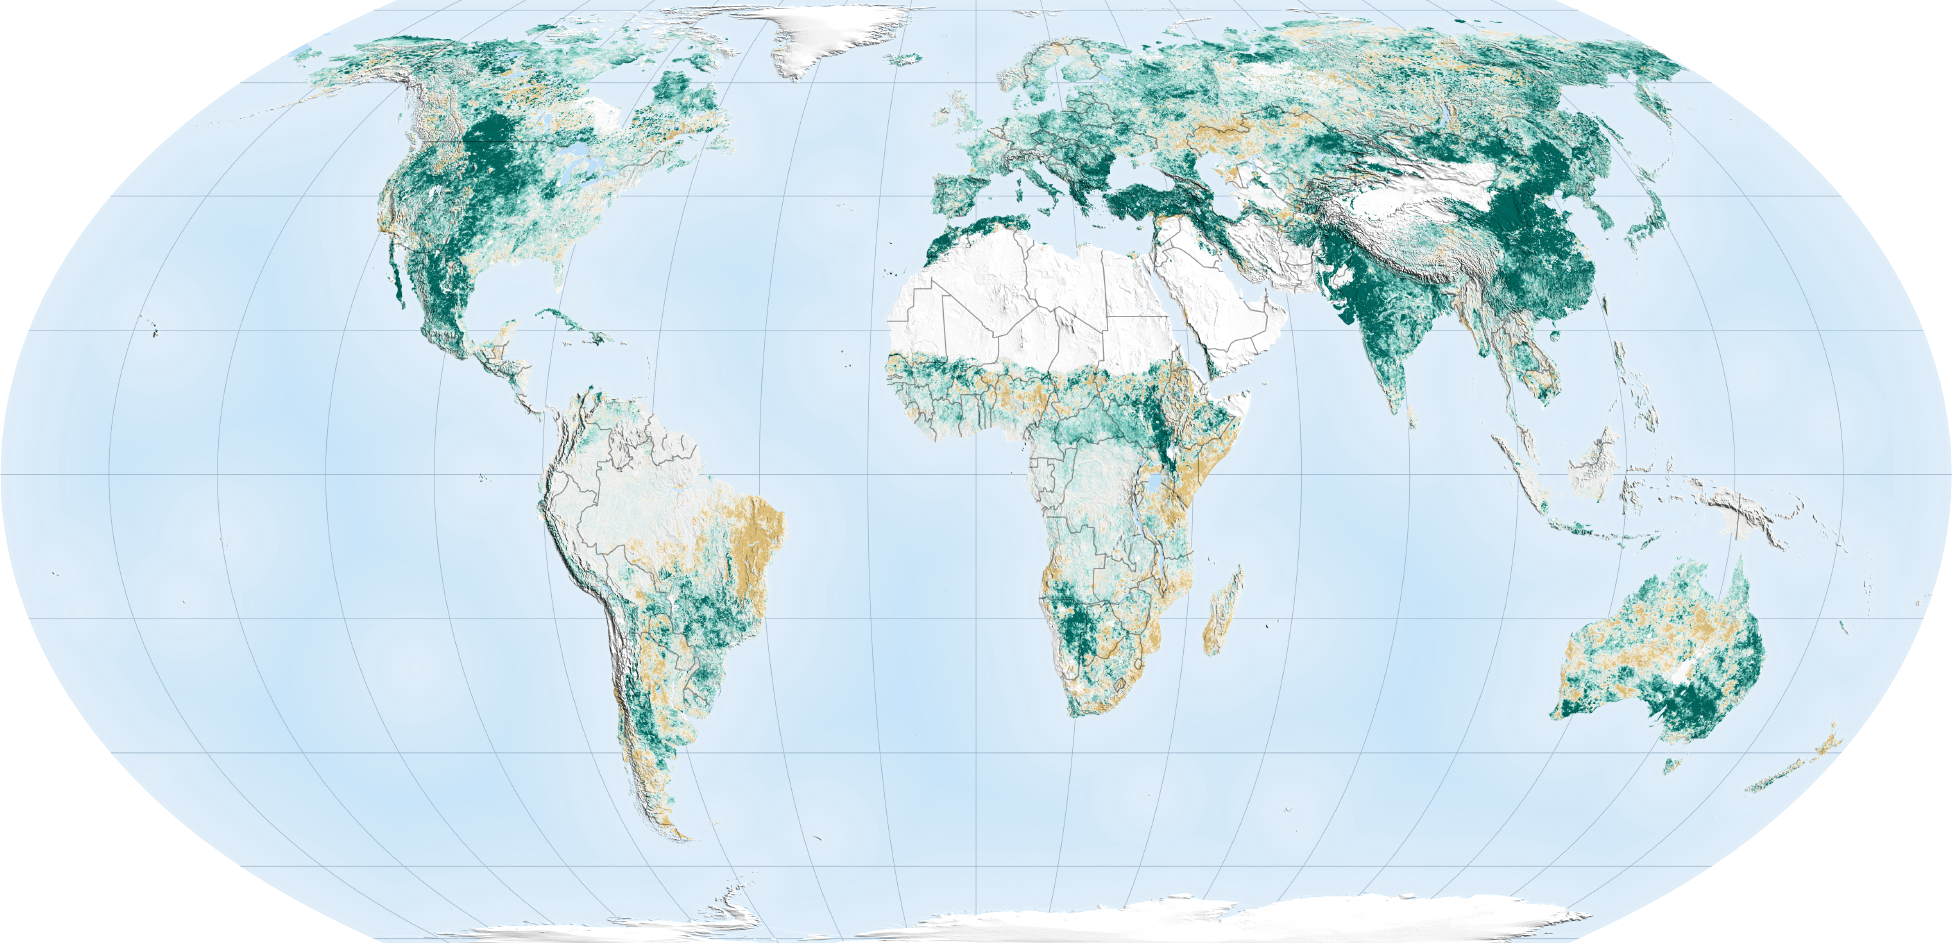
Green areas saw a growth in foliage from 2000 to 2017, while brown areas saw a drop. Joshua Stevens / NASA Earth Observatory
Quote:
2. The logarithmic effect of radiative forcing is already accounted for in IPCC models.
I don't think you understand that part. The amount of heat trapped from going from 100ppm CO2 to 200ppm is the same as that going from 200ppm to 400ppm, and the same as from 400ppm to 800ppm. The alarmist models claim that the heat generated is many multiples that of the heat trapped by the greenhouse effect, and that aspect is debated in academic circles.
Quote:
3. According to the IPCC, both tide gauges and satellites show an accelerating rise in global sea level since 1993. Skeptics cherry pick local gauges which show no acceleration due to natural local variability to support claims of no global acceleration.
This is the part that really doesn't stand scrutiny. Fact is, sea water rise levels are universal and uniform. The oceans rise due to two factors, thermal expansion of water, and ice from the polar caps (mostly antarctic) melting. The tidal gauge measurement are the combined effect of that universal sea water rise coupled with land movements, and while these vary from place to place, land movements are very linear. So if there was an acceleration in sea level rise, that acceleration will be visible on most tidal gauge measurements. The data however clearly contradicts that notion of accelerating sea level rise.
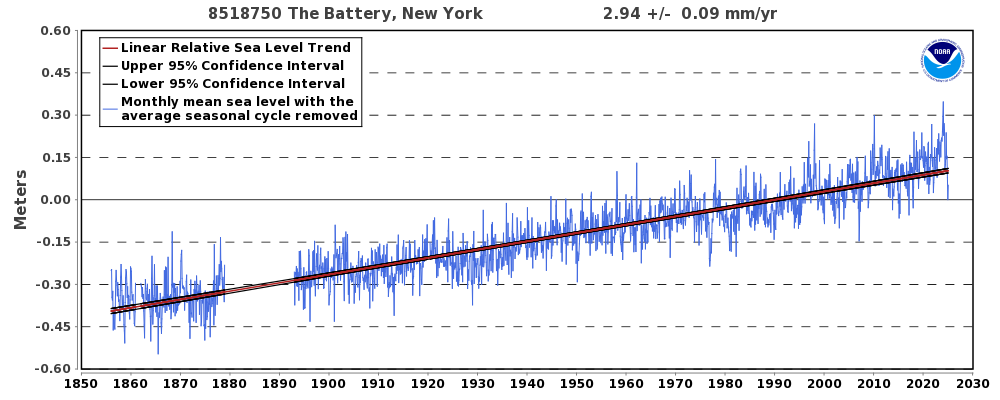
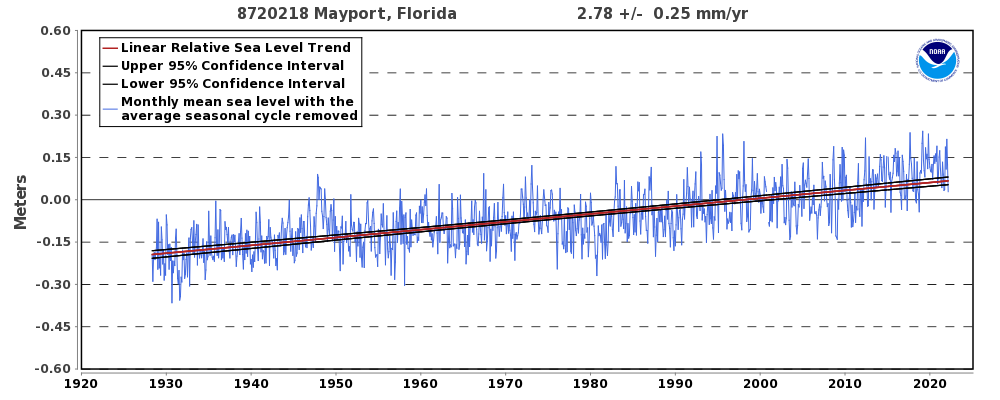
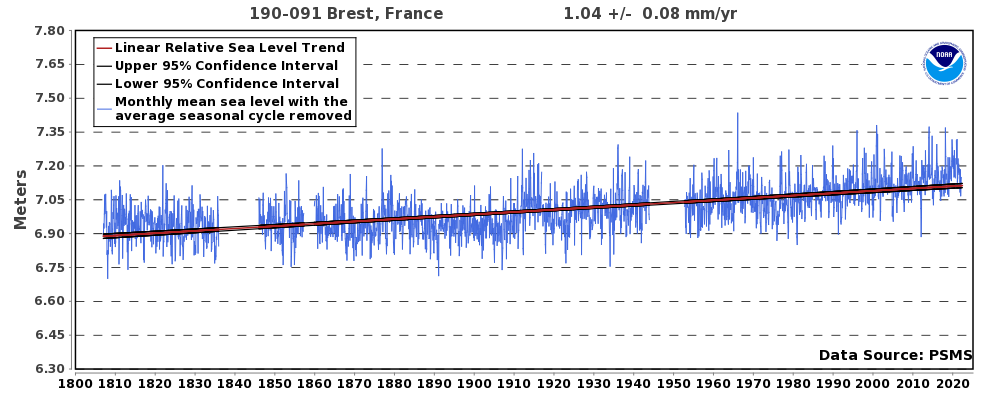
These data sets are powerful and reliable, because they span the last two centuries, and have been built with a very consistent methodology, unlike nearly every other temperature measurement used to justify the alarmist case. They clearly show that there has been no drastic acceleration in the rate of sea level rise over the last several decades.
Quote:
4. It is irrelevant that CO2 levels or even global temperatures have been higher at many points in the last billion years. It is the temporally local increase that is important because it is causing the changes in living conditions that people today and in the coming generations are going to have to reckon with.
The single most important impact of climate change on the human race is in the effect of climate on agricultural output, by a wide margin. In that aspect, higher CO2 levels have ironically been demonstrably beneficial.
The only mass starvation events we see in the modern era are from political factors (wars etc) and very limited geographically. In the 20th century when CO2 levels were lower you had several mass starvation events due to global crop failures (ironically enough, mostly from bad weather), and this despite the fact that the world population was a lot smaller.
IHowever we were still at CO2 levels from 50 years ago, one billion plus would have been threatened by starvation, and the price of cereals and other staples would have been higher.
You are missing several factors: first heat does not equal temperature, especially air temperature. Tremendous amounts of heat energy are used to convert water from ice to liquid and liquid to water vapor and to warm the oceans. An ice chest, sitting in the sun at the beach, absorbs heat from the sun continuously, but keeps the air around your food cold as the ice melts. However, once all the ice melts, the temperature soars. The ocean, which covers most of Earth's surface, is a huge heat sink. Inceased CO2 leads to acidification of water, and with increased water temperatures, is having tremendous negative effects on coral reefs and sea life in general. It is a negative for agriculture too, even if initially, CO2 is a benefit for crops.
So initially, the increase in CO2 does not increase air temperature as greatly. However, water vapor is itself a greenhouse gas. Methane, trapped in frozen Arctic tundra, is being released and it is an even stronger greenhouse gas. This eventually becomes a vicious circle and "runaway" effect. Planetary scientists believe something similar happened on Venus. Science understands these things better than you give them credit for. It is just a huge gamble to cause these massive changes to our planet, ones that scientists predict have huge negative consequences, and "hope" that it turns out OK just because we can find some short term positive benefits like crop productivity.
CO2 is hugely beneficial to agriculture and biomass on earth. Increases in CO2 have been the difference between mass starvation for the bottom 10-20% of humanity and crops being so abundant and productive that we have already reached peak farmland, meaning that the land needed to feed the world today is declining, even as demand for food and meat has skyrocketed due to China and other developing nations being able to afford meat today.
The baseline we use for CO2, levels from the 18th-19th century, were from a time when CO2 levels were dangerously low, in the high 200ppm. These levels were
some of the lowest in the entire history of the planet, to give you an idea of how low these were, a drop in CO2 concentration to below 200ppm would crash most crops, and at around 150ppm photosynthesis would cease altogether and life of earth would end! The planet was starved of CO2 before the industrial age.
Life and the planet thrived in periods where CO2 concentration were orders of magnitude higher than they are today.
Quote:
The world will not convert to renewable resources magically. The biggest issue is that the cost to the world, the "externalities," are not included in the price of fossil fuels. Sure, prices of renewables are low, in many cases lower than fossil fuels, but US subsidies for oil and gas and huge 100%+ tariffs on the lowest cost solar and electric cars are moving us in the wrong direction.
The world is converting to renewables, not magically but due to market forces alone and technological improvements in fields such as solar panels, batteries and EVs. Nuclear is back in favor, and new advances in thorium NPP will likely translate in a new global boom in the 2030s. 10 years from now the majority of cars in Europe will be EV, and in China, in less than 5 years. The ongoing war of choice on Iran and ensuing oil shock is also going to prompt consumers in places like Thailand, Australia, Japan or S Korea to switch to EVs.
I agree about subsidies to fossil fuels being bad policy, especially when there is a deliberate effort to stand in the way of renewables.
Quote:
If you look at Earth's past, during time periods with warmer temperatures and higher sea levels, life in extreme northern latitudes and even Antarctica, flourished. That is how Alaska and Russia got so much oil. As the Earth continues to warm, humans will continue to need to leave the less habitable tropical climes, especially the islands and arid regions, and relocate to the northern countries to survive. So humanitarian immigration policies will be necessary if we do not do anything to stop global warming.
Conditions are actually improving in most arid regions, consider the African Sahel or the Asian Gobi deserts, these deserts have been shrinking and greening. See my post above.
The IPCC and UN reports which have claimed that there would be hundreds of million of "climate refugees" have turned out to be wrong, over and over again, decade after decade. The main source of mass emigration is war, explosive population growth mostly in sub-saharan Africa, and people seeking better economic conditions. But this has very little to do with climate change.