OT: Duke Climate Change Study

110,227 Views | 861 Replies | Last: 7 yr ago by burritos
NVBear78
How long do you want to ignore this user?
Unit2Sucks;842859383 said:

Thanks for the misinformation via cherrypicking Cal88. i wouldn't expect anything less from you.

I don't have the time to counter all of your charts at this point but there are at least two that are manifestly suspect.

First, you used the heat wave index but not that doesn't contradict the quote that you referenced. There is other data from NOAA that shows that the percentage of land mass in the lower 48 with unusually hot summer temps is higher than ever for that period, and that still doesn't necessarily speak to the averages which the report purportedly discusses.

Second, as for the wattsupwithfakeclimatenews chart that you love to post about heat records - I note that it only goes through the 1990s. Do you have an updated version through 2016? Do you know how the list of records was calculated? Were the records evenly distributed by landmass across the country or are they perhaps skewed based on measurement stations? Who knows the answer, but the chart looks good to you so you love to post it here.

There is so much climate data out there and given your comfort posting false information, it's no wonder you always have just the chart to support your viewpoint, but only if you ignore the mountains of other data that support the truth.


Bullcrap, I never ever see warmers back up their assertions nor do I ever hear a reasonable explanation for the many, many errors in past predictions. I don't understand why all the erroneous predictions never seem to cause any doubts for a warmer. That's why I think of warmists as a cult or a religion.
BearNecessities
How long do you want to ignore this user?
Shame. This thread had died for a while, but some people refuse to let it go.
Cal88
How long do you want to ignore this user?
Unit2Sucks;842859426 said:

So just to be clear, you are saying these 13 federal agencies are incorrect that the last few decades are the warmest on record because an arbitrarily chosen list of the hottest days by state is overwhelmingly influenced by a few extreme what waves in 1930, 1934 and 1936? I had always assumed your stupid chart was based on all temperature stations to reflect some sort of geographical balance but it is literally just a list of hottest day for every state.

If someone asked you how good Cal football was in the 200's would you say we were the best team in FBS because we were theoretically ranked no 1 for the last few minutes of the 2007 OSU game? Or would you say we were one of the worst based on our low point in 2001?


You're telling me here that the program over the last decade has been the best ever, and yet there were no BCS appearances since 2000? While I'm pointing out that the program had won several national championships in the 1930s and was at least as good back then, which of course means that I'm a Mrs Sandowsky-level denier.

If indeed the last two decades were the hottest in the last 1,500 years, wouldn't you expect at least some of the maximum heat records to date from this millennium?!?

And if those scorching heat waves came repeatedly, and were clearly bunched up into the 1930s, wouldn't that indicate that the 1930s were hotter? That period was not just etched into the records, it was etched in American history and American culture, the hot scorching weather producing great economic and social upheaval across the center of the nation. The Dust Bowl destroyed the Midwest, repeated waves of hot and dry weather turned a whole region into a wasteland.

There is nothing from the current era that comes close, no repeated warming events that wrecked that much havoc. The global warming disasters that the IPCC has been predicting as imminent since the 1980s have yet to happen 30 years later. But they've already happened over 80 years ago, well before the advent of SUVs...

In much of the Midwest and eastern seaboard, summers have been getting milder. Before you cry East Coast Bias, the drier western half of the US has seen a substantial increase in its vegetation cover in the last 30 years (due to higher concentrations of atmospheric CO2):


[SIZE=2]change in vegetation cover between 1982 and 2015, attributed to CO2 rise[/SIZE] - click on map to see high-res version

https://www.nasa.gov/feature/goddard/2016/carbon-dioxide-fertilization-greening-earth

So yeah, "13 federal agencies" boils down to an empty catchphrase, if you care to look behind the headlines. Bureaucracies can't change very basic facts.
Unit2Sucks
How long do you want to ignore this user?
We all know you can pick cherries Cal88 and we've seen these cherries before. The NCA4 is chock full of charts that are more meaningful than your favorite denier ones. I could point them out but you'd still prefer yours so that you can continue to try to mislead people.

I could point out that 16 of the 17 hottest years on record have occurred since 2001 but you would point to a chart with 50ish data points and remind us all that the hottest recorded day in US history was at Death Valley in 1913. I would counter that the hottest recorded month at a location in US history was just recorded in Death Valley last month but you would talk about the dust bowl.
Cal88
How long do you want to ignore this user?
Unit2Sucks;842859452 said:

We all know you can pick cherries Cal88 and we've seen these cherries before. The NCA4 is chock full of charts that are more meaningful than your favorite denier ones. I could point them out but you'd still prefer yours so that you can continue to try to mislead people.

I could point out that 16 of the 17 hottest years on record have occurred since 2001 but you would point to a chart with 50ish data points and remind us all that the hottest recorded day in US history was at Death Valley in 1913. I would counter that the hottest recorded month at a location in US history was just recorded in Death Valley last month but you would talk about the dust bowl.


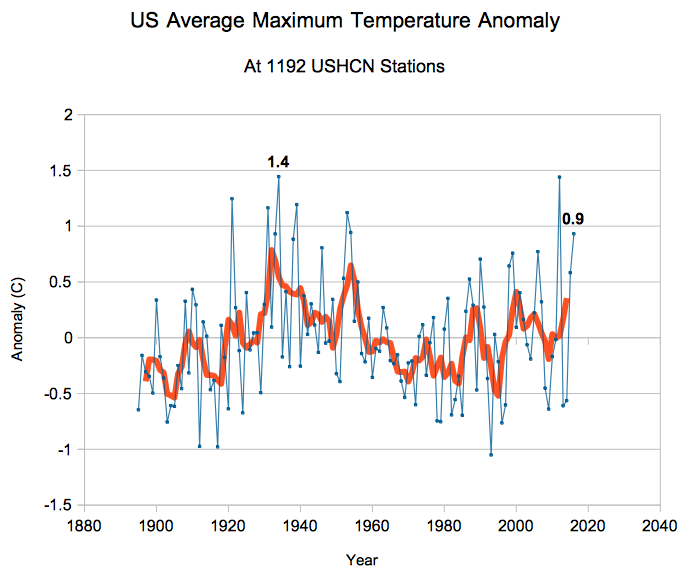
No, I would first tell you that in the 1930s, nearly twice as many weather stations across the US had registered temperatures over 100F, and that the average highs from that era where significantly higher than those from recent ones, with clear data to support those arguments, just to use the charts I've already posted. Not one isolated data point of Death Valley, but across nearly 1,200 weather stations and over an extended time period. That's not cherrypicking, it's the whole orchard's worth of cherries.

The argument that [U]US temperatures[/U] were at least as warm in the 1930s as they are today is a very basic one, because the data is there, every chart that wasn't recently adjusted by Hansen, Mann or Karl will unequivocally tell you this.


You're telling me that 16 of the last 17 years were the hottest ever, well then how come so few of these 1,200 weather stations across the US hit the 100F mark over that extended period, and how come nearly twice as many of these stations hit 100F in the 1930s plateau?

And if you're stating that 16 of the last 17 years were the hottest ever, what kind of adverse effects has this had over the US? Are there entire cities that have been overrun by weather refugees fleeing from scorching heat and drought? Why weren't there the kind of large scale catastrophic warming events that were regularly witnessed across the 1930s?
drizzlybears brother
How long do you want to ignore this user?
Cal88;842859444 said:

You're telling me here that the program over the last decade has been the best ever, and yet there were no BCS appearances since 2000? While I'm pointing out that the program had won several national championships in the 1930s and was at least as good back then, which of course means that I'm a Mrs Sandowsky-level denier.

If indeed the last two decades were the hottest in the last 1,500 years, wouldn't you expect at least some of the maximum heat records to date from this millennium?!?

And if those scorching heat waves came repeatedly, and were clearly bunched up into the 1930s, wouldn't that indicate that the 1930s were hotter? That period was not just etched into the records, it was etched in American history and American culture, the hot scorching weather producing great economic and social upheaval across the center of the nation. The Dust Bowl destroyed the Midwest, repeated waves of hot and dry weather turned a whole region into a wasteland.

There is nothing from the current era that comes close, no repeated warming events that wrecked that much havoc. The global warming disasters that the IPCC has been predicting as imminent since the 1980s have yet to happen 30 years later. But they've already happened over 80 years ago, well before the advent of SUVs...

In much of the Midwest and eastern seaboard, summers have been getting milder. Before you cry East Coast Bias, the drier western half of the US has seen a substantial increase in its vegetation cover in the last 30 years (due to higher concentrations of atmospheric CO2):


[SIZE=2]change in vegetation cover between 1982 and 2015, attributed to CO2 rise[/SIZE] - click on map to see high-res version

https://www.nasa.gov/feature/goddard/2016/carbon-dioxide-fertilization-greening-earth

So yeah, "13 federal agencies" boils down to an empty catchphrase, if you care to look behind the headlines. Bureaucracies can't change very basic facts.


I can only imagine the conversations between you and your neurosurgeon with all his elite neurosurgeon-y BS.

F-ing experts, you don't need to take their crap C88. You keep fighting.
NVBear78
How long do you want to ignore this user?
Cal88;842859468 said:

No, I would first tell you that in the 1930s, nearly twice as many weather stations across the US had registered temperatures over 100F, and that the average highs from that era where significantly higher than those from recent ones, with clear data to support those arguments, just to use the charts I've already posted. Not one isolated data point of Death Valley, but across nearly 1,200 weather stations and over an extended time period. That's not cherrypicking, it's the whole orchard's worth of cherries.

The argument that [U]US temperatures[/U] were at least as warm in the 1930s as they are today is a very basic one, because the data is there, every chart that wasn't recently adjusted by Hansen, Mann or Karl will unequivocally tell you this.


You're telling me that 16 of the last 17 years were the hottest ever, well then how come so few of these 1,200 weather stations across the US hit the 100F mark over that extended period, and how come nearly twice as many of these stations hit 100F in the 1930s plateau?

And if you're stating that 16 of the last 17 years were the hottest ever, what kind of adverse effects has this had over the US? Are there entire cities that have been overrun by weather refugees fleeing from scorching heat and drought? Why weren't there the kind of large scale catastrophic warming events that were regularly witnessed across the 1930s?


Shhhh, you're asking them to think on their own, that is not allowed with "settled science". They never seem bothered by the errors and inconsistencies
drizzlybears brother
How long do you want to ignore this user?
NVBear78;842859474 said:

Shhhh, you're asking them to think on their own, that is not allowed with "settled science". They never seem bothered by the errors and inconsistencies


Exactly, they are like sheep. They never think to ask why their sources are so hell-bent on a specific outcome. There seems to be no amount of evidence that will ever persuade them. The desperation with which they cling to their view is truly sad.
Cal88
How long do you want to ignore this user?
If they're like sheep, shouldn't their flatulence be more tightly regulated and taxed?

drizzlybears brother;842859469 said:

I can only imagine the conversations between you and your neurosurgeon with all his elite neurosurgeon-y BS.

F-ing experts, you don't need to take their crap C88. You keep fighting.


Right back at ya drizz bro.
drizzlybears brother
How long do you want to ignore this user?
Cal88;842859496 said:

If they're like sheep, shouldn't their flatulence be more tightly regulated and taxed?


Right back at ya drizz bro.


Flatulence isn't where I'd start, but to each his own.
GivemTheAxe
How long do you want to ignore this user?
Unit2Sucks;842859426 said:

So just to be clear, you are saying these 13 federal agencies are incorrect that the last few decades are the warmest on record because an arbitrarily chosen list of the hottest days by state is overwhelmingly influenced by a few extreme what waves in 1930, 1934 and 1936? I had always assumed your stupid chart was based on all temperature stations to reflect some sort of geographical balance but it is literally just a list of hottest day for every state.

If someone asked you how good Cal football was in the 200's would you say we were the best team in FBS because we were theoretically ranked no 1 for the last few minutes of the 2007 OSU game? Or would you say we were one of the worst based on our low point in 2001?


Also the phenomenon is called "Global Climate Change" or "Global Warming" not "U.S. Climate Change." Limiting data to U.S. data will skew the results.
Unit2Sucks
How long do you want to ignore this user?
drizzlybears brother;842859483 said:

Exactly, they are like sheep. They never think to ask why their sources are so hell-bent on a specific outcome. There seems to be no amount of evidence that will ever persuade them. The desperation with which they cling to their view is truly sad.


Yup. Here's the latest draft of NCA4 so everyone can review to their heart's content and decide for themselves. I've also included below what I think is one of, if not the, most important chart in the document.


oski003
How long do you want to ignore this user?
It's interesting that we have more land and ocean temperature anomalies today than in 1880. How did one detect such an anomaly in 1880?
Unit2Sucks
How long do you want to ignore this user?
oski003;842859558 said:

It's interesting that we have more land and ocean temperature anomalies today than in 1880. How did one detect such an anomaly in 1880?


Must be time travel.
Cal88
How long do you want to ignore this user?
Unit2Sucks;842859547 said:

Yup. Here's the latest draft of NCA4 so everyone can review to their heart's content and decide for themselves. I've also included below what I think is one of, if not the, most important chart in the document.


This looks like the most recent iteration of NOAA's global climate chart, with the latest round of Pause-busting adjustments, on top of other adjustments they've made to their data set from the 20th century. The man who was in charge of NOAA and compiled this chart is Thomas Karl, director of NOAA's National Climatic Data Center, he just recently retired.

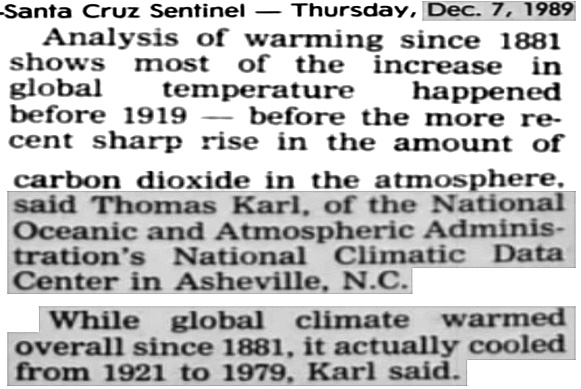
This is what Karl was saying all the way back in 1989:


Tom Karl declared unequivocally in 1989 (back when climate wasn't a heavily politicized issue) that global temperatures cooled between 1921 and 1979..This was clearly reflected in NOAA's previous graphs published before this century.

However, his subsequently modified graph U2S posted above shows instead [U]a definite warming between 1921 and 1979 (of around 0.75F)[/U]. This is entirely due to a series of recent adjustments to the entire data set that were applied by Karl, Mann and other weather center heads.

Those data modifications at the three leading weather data centers were carefully documented in a recent peer-reviewed scientific study, link:

https://thsresearch.files.wordpress.com/2017/05/ef-gast-data-research-report-062717.pdf

Here is a main result of this study, the graph below shows the changes that were made to the data sets (red bars are upwards adjustments, blue downwards), just between 2008 and 2016 (there have been additional modifications since 2016, and others before 2008; those adjustments always push up recent readings and push down older data):


As you can see from this adjustments chart, the warm 1930s period was pushed downwards, while the values from last four decades were bumped up, changing older data into a steeper upwards curve.

The authors concluded:

Quote:

Nearly all of the warming they are now showing are in the adjustments,” Meteorologist Joe D’Aleo, a study co-author, told The Daily Caller News Foundation. “Each dataset pushed down the 1940s warming and pushed up the current warming.”

“You would think that when you make adjustments you’d sometimes get warming and sometimes get cooling. That’s almost never happened,” said D’Aleo, who co-authored the study with statistician James Wallace and Cato Institute climate scientist Craig Idso.

Their study found measurements “nearly always exhibited a steeper warming linear trend over its entire history,” which was “nearly always accomplished by systematically removing the previously existing cyclical temperature pattern.”

“The conclusive findings of this research are that the three [global average surface temperature] data sets are not a valid representation of reality,” the study found. “In fact, the magnitude of their historical data adjustments, that removed their cyclical temperature patterns, are totally inconsistent with published and credible U.S. and other temperature data.”

Based on these results, the study’s authors claim the science underpinning the Environmental Protection Agency’s (EPA) authority to regulate greenhouse gases “is invalidated.”

Cal88
How long do you want to ignore this user?
Unit2Sucks;842859565 said:

Must be time travel.


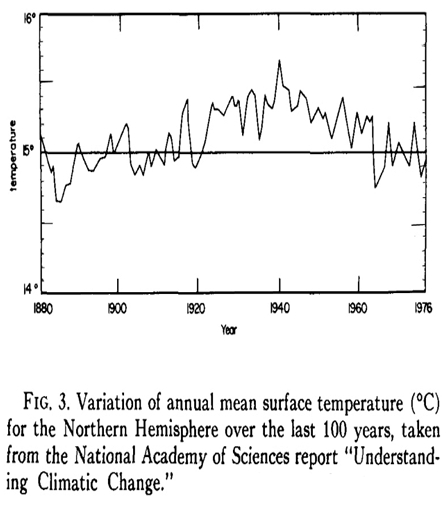
I don't think they've resorted to paleo-climate reconstruction for the late 19th century data, there were reliable temperature readings, mostly in the northern hemisphere back then, like this one:


The issue of course, is what they did to this data, because it sure as hell doesn't look anything like the last graph you've posted above, here it is again:


As you can see, they've turned the warming period from 1880 to 1910 into a cooling phase. This manipulation is reflected in the very steep downwards gradient you see in the left end (1880-1910) of the adjustment chart:


Karl, Mann and co have erased the warming between 1880 and 1910, actually turning it into a cooling period, in order to provide a lower anchor for their 20th century warming, shifting further up the slope of the warming trend between 1910 and 2015 on their graph.

This is the finding of the adjustments study I've linked above, and one of the conclusions its authors drew: the deliberate removal of natural cyclical temperature patterns and the deliberate construction of a steeper linear modern warming trend.
Unit2Sucks
How long do you want to ignore this user?
Figured you'd reference Goddard and his chart. So just to be clear - do you think Goddard is reliable? Isn't he the same guy that a well-regarded (by you) climate journalist recently said "I was so used to Goddard being wrong"? Is Anthony Watts correct that Goddard is frequently wrong?
Cal88
How long do you want to ignore this user?
Unit2Sucks;842859608 said:

Figured you'd reference Goddard and his chart. So just to be clear - do you think Goddard is reliable? Isn't he the same guy that a well-regarded (by you) climate journalist recently said "I was so used to Goddard being wrong"? Is Anthony Watts correct that Goddard is frequently wrong?


U2S, you're confusing Steven Goddard with the Goddard Institute of Space Studies (GISS), no relation! The chart I've posted is not his, it is just a tabulation of all modifications/adjustments based on official GISS data by Wallace, d'Aleo and Idso in their peer-reviewed study, and not the opinion of Steven Goddard (though I'm sure he agrees with the findings of this study).

Incidentally, GISS is located in the building housing Tom's Diner south of Columbia, the infamous Seinfeld diner. Next time I'm there I'm going to bug some of their staff with that chart.

Unit2Sucks
How long do you want to ignore this user?
Ha! My bad.
Cal88;842859613 said:

U2S, you're confusing Steven Goddard with the Goddard Institute of Space Studies (GISS), no relation!


Interesting note about Tom's Restaurant too.
GivemTheAxe
How long do you want to ignore this user?
GivemTheAxe;842859205 said:

Simple solution for Pres. Trump. Simply close down the 13 Agencies. Then the facts reported by those agencies disappear as well.
Much as Scaramucci's comments contradicting Trump were magically undone where he (Scaramucci) deleted his Tweets. disappeared


OK I called it (well almost). The Pres Is closing down the entity making the report.
Huffington Post had just reported that Pres Trump had dissolved (not renewed the charter of) the panel of scientists (Sustained National Climate Assessment Federal Advisory Committee) which published the draft report (National Climate Assessment) cited. It had been scheduled for formal publication in 2018.

NOAA in defiance reports that the disbandment would not impact the completion of the formal report.

For my next act I am predicting that Cal will go 6-6 this season.
Unit2Sucks
How long do you want to ignore this user?
Seems like as good a time as any to revive this thread.

Previously a poster mentioned that one of the positive benefits of climate change (which by the way, the climate isn't changing, if it is changing it has nothing to do with humans, if it is caused by humans is the Chinese, and in any event the climate is always changing) was that the increase in CO2 is great for food production.

I recently read an article that talks about the fact that the increase in CO2 has led to a decrease in nutrient value in food. Very interesting if true. I'm sure the usual suspects will raise the usual points but this is the sort of thing that I thought many here would find valuable.
burritos
How long do you want to ignore this user?


Increase the organic material in the soil. Turns into carbon sinks which what mother nature evolved it to be. You can start with woodchips(not the color dyed kind that they sell in Home Depot).

Just a side not for Cal people, but the father of pedology(soil science) is Hans Jenny a former Cal prof. His work probably should have garnered a Nobel, but dirt isn't sexy enough a topic I suppose.

https://en.wikipedia.org/wiki/Hans_Jenny_(pedologist)
burritos
How long do you want to ignore this user?
http://michaelpollan.com/articles-archive/a-secret-weapon-to-fight-climate-change-dirt/

A potentially epiphanic understanding/perspective of soil and atmospheric CO2. Of course, I put it at a 90% chance that another world war will occur before global adoption of these recommendations is widespread.
 
×
subscribe Verify your student status
See Subscription Benefits
Trial only available to users who have never subscribed or participated in a previous trial.