UN report: Effects of climate change even more severe than we thought

52,370 Views | 512 Replies | Last: 2 mo ago by Eastern Oregon Bear
concordtom
How long do you want to ignore this user?
dajo9 said:

bearister said:

Walnut Creek:


….and I'm fantasizing this:


20+ years I've lived in New Jersey. Winters have gotten much more mild. Used to be snow on the ground all winter. Now the norm is it melts in a week or so.

Better hurry up and elect Trump so we can ignore all this even more. Trump is the ostrich President.


Sadly, nobody nowhere is stopping it.

Start looking at British Columbia? Cold Pacific current.
Alaska too far north. Winter sun issues.

How about less extreme: Oregon coast!!
concordtom
How long do you want to ignore this user?
112 for me today.
dajo9
How long do you want to ignore this user?
concordtom said:

112 for me today.


You can thank Republican voters for that
Cal88
How long do you want to ignore this user?
dajo9 said:

concordtom said:

112 for me today.


You can thank Republican voters for that


It's 112F in Concord, CA today because of... Republican voters?
concordtom
How long do you want to ignore this user?
Cal88 said:

dajo9 said:

concordtom said:

112 for me today.


You can thank Republican voters for that


It's 112F in Concord, CA today because of... Republican voters?

Political temperature, yes!
dajo9
How long do you want to ignore this user?
Cal88 said:

dajo9 said:

concordtom said:

112 for me today.


You can thank Republican voters for that


It's 112F in Concord, CA today because of... Republican voters?


Yep
Cal88
How long do you want to ignore this user?
Forecast for Concord, CA today is high of 96F, low a chilly 59F.

I would like to thank all Democrat voters for making this return to normal temperatures possible. Whatever you did this weekend - composted your coffee grounds, used a metal straw, or sacrificed a virgin at dawn on top of Mount Tam - it worked.
dajo9
How long do you want to ignore this user?
Cal88 said:

Forecast for Concord, CA today is high of 96F, low a chilly 59F.

I would like to thank all Democrat voters for making this return to normal temperatures possible. Whatever you did this weekend - composted your coffee grounds, used a metal straw, or sacrificed a virgin at dawn on top of Mount Tam - it worked.


Today will be counted in the averages that are giving us continual record high temperatures too.
https://www.threads.net/@earthlyeducation/post/C8_zp5Fv6Y7/?xmt=AQGzqc-MoGeZJgWARjf41fWoSD6L0CXxqeaEAo5ywRdXng
Cal88
How long do you want to ignore this user?
dajo9 said:

Cal88 said:

Forecast for Concord, CA today is high of 96F, low a chilly 59F.

I would like to thank all Democrat voters for making this return to normal temperatures possible. Whatever you did this weekend - composted your coffee grounds, used a metal straw, or sacrificed a virgin at dawn on top of Mount Tam - it worked.


Today will be counted in the averages that are giving us continual record high temperatures too.
https://www.threads.net/@earthlyeducation/post/C8_zp5Fv6Y7/?xmt=AQGzqc-MoGeZJgWARjf41fWoSD6L0CXxqeaEAo5ywRdXng

The reason the data sample above is set to be from 1940 to 2014 is that to this day, most record heat days in the US is from the 1930s. This is the kind of manipulative cherry-picking that is used to create the alarmist climate narrative that prevails today.


The series of massive, brutal heat waves and droughts that hit north America in the 1930s that practically destroyed vast swaths of the midwest and created the Dust Bowl, worst environmental catastrophe in US history, have never been equaled since, not even close. IIRC temps of 120F were recorded in the Bay Area.


Most of the increase in heat observed today is due to the urbanisation around weather stations, resulting in higher local temperatures (what is referred as urban heat island effect):


The UHI effect raises local observed temperatures by up to 8-10 degrees F, and completely skews and drowns global warming measurements which attempt to measure changes in tenths of a degree. For example, sticking with Tom's corner, the Contra Costa Airport is today in the middle of a built up urban space, surrounded by highways, buildings and malls, whereas back decades ago that weather station was located in an exurb with plenty of green space around it.

dajo9
How long do you want to ignore this user?
Cal88's data from the 1930s is for the U.S. only because the U.S. did have an unprecedented heat wave in the 1930s but the globe did not. He is cherrypicking the data and science again. It is what he does. The full takedown can be read here.
https://www.google.com/amp/s/www.wfla.com/weather/climate-classroom/does-1930s-record-heat-undermine-the-science-of-man-made-climate-change/amp/
Eastern Oregon Bear
How long do you want to ignore this user?
dajo9 said:

Cal88's data from the 1930s is for the U.S. only because the U.S. did have an unprecedented heat wave in the 1930s but the globe did not. He is cherrypicking the data and science again. It is what he does. The full takedown can be read here.
https://www.google.com/amp/s/www.wfla.com/weather/climate-classroom/does-1930s-record-heat-undermine-the-science-of-man-made-climate-change/amp/
His first graph conveniently stops at 2018 and ignores the heat waves of the last 5 1/2 years. Cherrypicking again.

He also states that the Bay Area had temperatures reaching 120 back in the 1930s. I'd like to see some proof of that as I'm fairly confident that never happened, at least not with a properly set up thermometer in a reasonable location.

Update: I did a little research after posting this. Calistoga hit 117 or 118 a couple of years ago but maxed out at 114 in the 1930s. Most other Bay Area location record highs were 115 or lower and mainly happened in the last few years. Overall, few locations even had temperatures from the 1930s in their top ten. Go to https://xmacis.rcc-acis.org/ if you want to do your own research. The site does have a bit of a learning curve.
Cal88
How long do you want to ignore this user?
dajo9 said:

Cal88's data from the 1930s is for the U.S. only because the U.S. did have an unprecedented heat wave in the 1930s but the globe did not. He is cherrypicking the data and science again. It is what he does. The full takedown can be read here.
https://www.google.com/amp/s/www.wfla.com/weather/climate-classroom/does-1930s-record-heat-undermine-the-science-of-man-made-climate-change/amp/

Your "data" was this gem, sounds very scientific!
Quote:

20+ years I've lived in New Jersey. Winters have gotten much more mild. Used to be snow on the ground all winter. Now the norm is it melts in a week or so.
dajo9
How long do you want to ignore this user?
Cal88 said:

dajo9 said:

Cal88's data from the 1930s is for the U.S. only because the U.S. did have an unprecedented heat wave in the 1930s but the globe did not. He is cherrypicking the data and science again. It is what he does. The full takedown can be read here.
https://www.google.com/amp/s/www.wfla.com/weather/climate-classroom/does-1930s-record-heat-undermine-the-science-of-man-made-climate-change/amp/

Your "data" was this gem, sounds very scientific!
Quote:

20+ years I've lived in New Jersey. Winters have gotten much more mild. Used to be snow on the ground all winter. Now the norm is it melts in a week or so.


Yep. Everybody can see with their own eyes what the scientists are telling us and you out here feeding people lies.
Cal88
How long do you want to ignore this user?
Eastern Oregon Bear said:

dajo9 said:

Cal88's data from the 1930s is for the U.S. only because the U.S. did have an unprecedented heat wave in the 1930s but the globe did not. He is cherrypicking the data and science again. It is what he does. The full takedown can be read here.
https://www.google.com/amp/s/www.wfla.com/weather/climate-classroom/does-1930s-record-heat-undermine-the-science-of-man-made-climate-change/amp/
His first graph conveniently stops at 2018 and ignores the heat waves of the last 5 1/2 years. Cherrypicking again.


The most updated version of that curve I could find was on the EPA site, it goes through 2021, here it is:
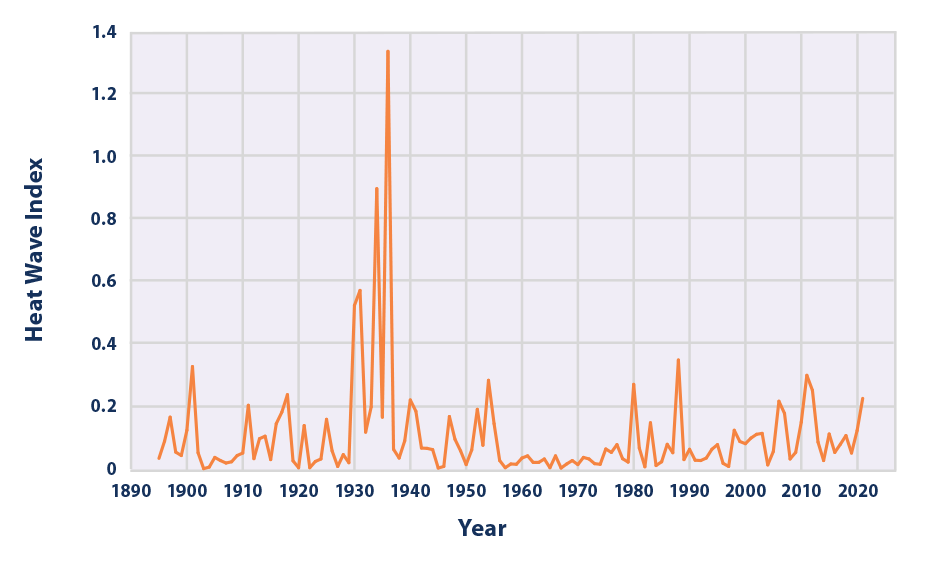

Based on this comprehensive historical data, you would have to be a complete idiot to not understand that the 1930s was the hottest decade in the US - by a wide margin
https://www.epa.gov/climate-indicators/climate-change-indicators-heat-waves (look for Figure 3)

If you believe the data from 2022-24 which will come out in a couple of years is going to approach that of the 1930s, you have no notion of US climate history or what the 1930s heat wave and Dust Bowl were like. Perhaps you could pick up a copy of Grapes of Wrath again.

Quote:

Quote:

He also states that the Bay Area had temperatures reaching 120 back in the 1930s. I'd like to see some proof of that as I'm fairly confident that never happened, at least not with a properly set up thermometer in a reasonable location.

Update: I did a little research after posting this. Calistoga hit 117 or 118 a couple of years ago but maxed out at 114 in the 1930s. Most other Bay Area location record highs were 115 or lower and mainly happened in the last few years. Overall, few locations even had temperatures from the 1930s in their top ten. Go to https://xmacis.rcc-acis.org/ if you want to do your own research. The site does have a bit of a learning curve


Here is what I found for the Bay Area, a list from 2017:

https://abc7news.com/all-time-record-heat-bay-area-highest-temperatures-recorded-hot-weather-hottest-list/2366693/

Quote:

SAN FRANCISCO (KGO) -- With triple digit temps popping up across the Bay Area, many are wondering - when's the last time we saw weather like this and are we breaking any records?
Here's a look at the all-time high temperatures in the Bay Area:
SAN FRANCISCO:
  • 103 degrees in San Francisco on June 13, 2000 (record broken with 106 degrees in SF on Sept. 1, 2017)
  • 103 degrees at San Francisco international Airport on Sept. 14, 1971
EAST BAY:
  • 115 in Livermore on Sept. 3, 1950
  • 107 degrees in Richmond on Sept. 15, 1971
SOUTH BAY:
  • 115 degrees in Gilroy on July 15, 1972
PENINSULA:
  • 94 degrees in Half Moon Bay on Oct. 27, 2003
NORTH BAY:
  • 116 degrees in Healdsburg on July 13, 1972
  • 113 degrees in Santa Rosa on July 11, 1913
  • 114 degrees in Calistoga on July 4, 1931
  • 113 degrees in Napa on June 14, 1961
  • 112 degrees in Kentfield on July 11, 1913
  • 110 degrees in San Rafael on June 15, 1961
SOUTH BAY:
  • 109 degrees in San Jose on June 14, 2000
  • 106 degrees at Moffett Field on June 14, 2000


The 1930s held the most heat records across the US, but not in the Bay Area.

The populations of Calistoga, Napa, SJ or Livermore today are far larger than in decades past, and the modern urban layout far different, with parking lots, roads, buildings and concrete surfaces that replaced bare rolling hills or orchards. The effect from this, known as urban heat island, accounts for a temperature delta of over 10F. This is not taken into consideration by alarmists.


bearister
How long do you want to ignore this user?
Temperatures 1.5C above pre-industrial era average for 12 months, data shows


https://www.theguardian.com/environment/article/2024/jul/08/temperatures-1-point-5c-above-pre-industrial-era-average-for-12-months-data-shows?CMP=Share_iOSApp_Other

"Copernicus, a scientific organisation that belongs to the EU's space programme, uses billions of measurements from satellites, ships, aircraft and weather stations to track key climate metrics. It found June 2024 was hotter than any other June on record and was the 12th month in a row with temperatures 1.5C greater than their average between 1850 and 1900."
Cancel my subscription to the Resurrection
Send my credentials to the House of Detention
I got some friends inside
Eastern Oregon Bear
How long do you want to ignore this user?
Cal88 said:

Eastern Oregon Bear said:

dajo9 said:

Cal88's data from the 1930s is for the U.S. only because the U.S. did have an unprecedented heat wave in the 1930s but the globe did not. He is cherrypicking the data and science again. It is what he does. The full takedown can be read here.
https://www.google.com/amp/s/www.wfla.com/weather/climate-classroom/does-1930s-record-heat-undermine-the-science-of-man-made-climate-change/amp/
His first graph conveniently stops at 2018 and ignores the heat waves of the last 5 1/2 years. Cherrypicking again.


The most updated version of that curve I could find was on the EPA site, it goes through 2021, here it is:


Based on this comprehensive historical data, you would have to be a complete idiot to not understand that the 1930s was the hottest decade in the US - by a wide margin
https://www.epa.gov/climate-indicators/climate-change-indicators-heat-waves (look for Figure 3)

If you believe the data from 2022-24 which will come out in a couple of years is going to approach that of the 1930s, you have no notion of US climate history or what the 1930s heat wave and Dust Bowl were like. Perhaps you could pick up a copy of Grapes of Wrath again.

Quote:

Quote:

He also states that the Bay Area had temperatures reaching 120 back in the 1930s. I'd like to see some proof of that as I'm fairly confident that never happened, at least not with a properly set up thermometer in a reasonable location.

Update: I did a little research after posting this. Calistoga hit 117 or 118 a couple of years ago but maxed out at 114 in the 1930s. Most other Bay Area location record highs were 115 or lower and mainly happened in the last few years. Overall, few locations even had temperatures from the 1930s in their top ten. Go to https://xmacis.rcc-acis.org/ if you want to do your own research. The site does have a bit of a learning curve


Here is what I found for the Bay Area, a list from 2017:

https://abc7news.com/all-time-record-heat-bay-area-highest-temperatures-recorded-hot-weather-hottest-list/2366693/

Quote:

SAN FRANCISCO (KGO) -- With triple digit temps popping up across the Bay Area, many are wondering - when's the last time we saw weather like this and are we breaking any records?
Here's a look at the all-time high temperatures in the Bay Area:
SAN FRANCISCO:
  • 103 degrees in San Francisco on June 13, 2000 (record broken with 106 degrees in SF on Sept. 1, 2017)
  • 103 degrees at San Francisco international Airport on Sept. 14, 1971
EAST BAY:
  • 115 in Livermore on Sept. 3, 1950
  • 107 degrees in Richmond on Sept. 15, 1971
SOUTH BAY:
  • 115 degrees in Gilroy on July 15, 1972
PENINSULA:
  • 94 degrees in Half Moon Bay on Oct. 27, 2003
NORTH BAY:
  • 116 degrees in Healdsburg on July 13, 1972
  • 113 degrees in Santa Rosa on July 11, 1913
  • 114 degrees in Calistoga on July 4, 1931
  • 113 degrees in Napa on June 14, 1961
  • 112 degrees in Kentfield on July 11, 1913
  • 110 degrees in San Rafael on June 15, 1961
SOUTH BAY:
  • 109 degrees in San Jose on June 14, 2000
  • 106 degrees at Moffett Field on June 14, 2000


The 1930s held the most heat records across the US, but not in the Bay Area.

The populations of Calistoga, Napa, SJ or Livermore today are far larger than in decades past, and the modern urban layout far different, with parking lots, roads, buildings and concrete surfaces that replaced bare rolling hills or orchards. The effect from this, known as urban heat island, accounts for a temperature delta of over 10F. This is not taken into consideration by alarmists.
As is typical for you, when you're caught in an exaggeration, you come up with another exaggeration to try and explain the previous one away.

From the EPA:

"Heat islands are urbanized areas that experience higher temperatures than outlying areas. Structures such as buildings, roads, and other infrastructure absorb and re-emit the sun's heat more than natural landscapes such as forests and water bodies. Urban areas, where these structures are highly concentrated and greenery is limited, become "islands" of higher temperatures relative to outlying areas. Daytime temperatures in urban areas are about 1-7F higher than temperatures in outlying areas and nighttime temperatures are about 2-5F higher."
Cal88
How long do you want to ignore this user?
Eastern Oregon Bear said:

Cal88 said:

Eastern Oregon Bear said:

dajo9 said:

Cal88's data from the 1930s is for the U.S. only because the U.S. did have an unprecedented heat wave in the 1930s but the globe did not. He is cherrypicking the data and science again. It is what he does. The full takedown can be read here.
https://www.google.com/amp/s/www.wfla.com/weather/climate-classroom/does-1930s-record-heat-undermine-the-science-of-man-made-climate-change/amp/
His first graph conveniently stops at 2018 and ignores the heat waves of the last 5 1/2 years. Cherrypicking again.


The most updated version of that curve I could find was on the EPA site, it goes through 2021, here it is:


Based on this comprehensive historical data, you would have to be a complete idiot to not understand that the 1930s was the hottest decade in the US - by a wide margin
https://www.epa.gov/climate-indicators/climate-change-indicators-heat-waves (look for Figure 3)

If you believe the data from 2022-24 which will come out in a couple of years is going to approach that of the 1930s, you have no notion of US climate history or what the 1930s heat wave and Dust Bowl were like. Perhaps you could pick up a copy of Grapes of Wrath again.

Quote:

Quote:

He also states that the Bay Area had temperatures reaching 120 back in the 1930s. I'd like to see some proof of that as I'm fairly confident that never happened, at least not with a properly set up thermometer in a reasonable location.

Update: I did a little research after posting this. Calistoga hit 117 or 118 a couple of years ago but maxed out at 114 in the 1930s. Most other Bay Area location record highs were 115 or lower and mainly happened in the last few years. Overall, few locations even had temperatures from the 1930s in their top ten. Go to https://xmacis.rcc-acis.org/ if you want to do your own research. The site does have a bit of a learning curve


Here is what I found for the Bay Area, a list from 2017:

https://abc7news.com/all-time-record-heat-bay-area-highest-temperatures-recorded-hot-weather-hottest-list/2366693/

Quote:

SAN FRANCISCO (KGO) -- With triple digit temps popping up across the Bay Area, many are wondering - when's the last time we saw weather like this and are we breaking any records?
Here's a look at the all-time high temperatures in the Bay Area:
SAN FRANCISCO:
  • 103 degrees in San Francisco on June 13, 2000 (record broken with 106 degrees in SF on Sept. 1, 2017)
  • 103 degrees at San Francisco international Airport on Sept. 14, 1971
EAST BAY:
  • 115 in Livermore on Sept. 3, 1950
  • 107 degrees in Richmond on Sept. 15, 1971
SOUTH BAY:
  • 115 degrees in Gilroy on July 15, 1972
PENINSULA:
  • 94 degrees in Half Moon Bay on Oct. 27, 2003
NORTH BAY:
  • 116 degrees in Healdsburg on July 13, 1972
  • 113 degrees in Santa Rosa on July 11, 1913
  • 114 degrees in Calistoga on July 4, 1931
  • 113 degrees in Napa on June 14, 1961
  • 112 degrees in Kentfield on July 11, 1913
  • 110 degrees in San Rafael on June 15, 1961
SOUTH BAY:
  • 109 degrees in San Jose on June 14, 2000
  • 106 degrees at Moffett Field on June 14, 2000


The 1930s held the most heat records across the US, but not in the Bay Area.

The populations of Calistoga, Napa, SJ or Livermore today are far larger than in decades past, and the modern urban layout far different, with parking lots, roads, buildings and concrete surfaces that replaced bare rolling hills or orchards. The effect from this, known as urban heat island, accounts for a temperature delta of over 10F. This is not taken into consideration by alarmists.
As is typical for you, when you're caught in an exaggeration, you come up with another exaggeration to try and explain the previous one away.

From the EPA:

"Heat islands are urbanized areas that experience higher temperatures than outlying areas. Structures such as buildings, roads, and other infrastructure absorb and re-emit the sun's heat more than natural landscapes such as forests and water bodies. Urban areas, where these structures are highly concentrated and greenery is limited, become "islands" of higher temperatures relative to outlying areas. Daytime temperatures in urban areas are about 1-7F higher than temperatures in outlying areas and nighttime temperatures are about 2-5F higher."


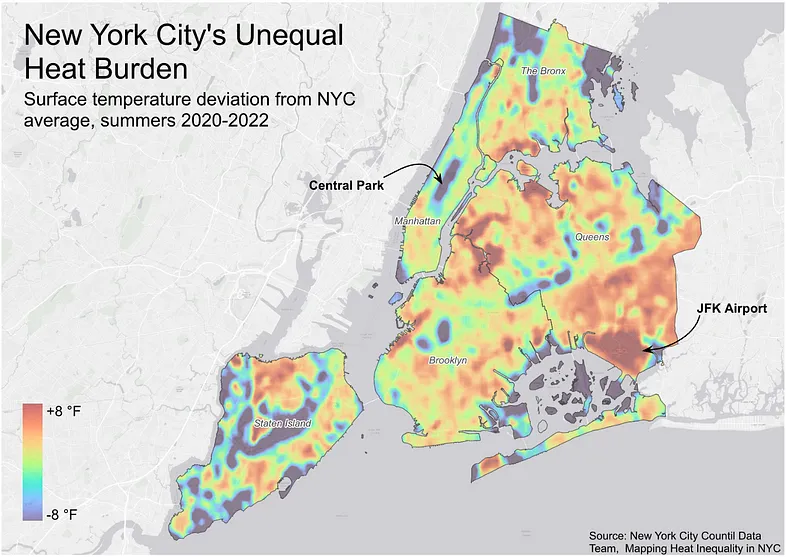
The thermal image of NYC posted above, reposted below, shows a difference in temperature between Central Park and JFK airport of about 14F-15F.


Most airports have weather stations and are part of the climate data.
Eastern Oregon Bear
How long do you want to ignore this user?
Cal88 said:

Eastern Oregon Bear said:

Cal88 said:

Eastern Oregon Bear said:

dajo9 said:

Cal88's data from the 1930s is for the U.S. only because the U.S. did have an unprecedented heat wave in the 1930s but the globe did not. He is cherrypicking the data and science again. It is what he does. The full takedown can be read here.
https://www.google.com/amp/s/www.wfla.com/weather/climate-classroom/does-1930s-record-heat-undermine-the-science-of-man-made-climate-change/amp/
His first graph conveniently stops at 2018 and ignores the heat waves of the last 5 1/2 years. Cherrypicking again.


The most updated version of that curve I could find was on the EPA site, it goes through 2021, here it is:


Based on this comprehensive historical data, you would have to be a complete idiot to not understand that the 1930s was the hottest decade in the US - by a wide margin
https://www.epa.gov/climate-indicators/climate-change-indicators-heat-waves (look for Figure 3)

If you believe the data from 2022-24 which will come out in a couple of years is going to approach that of the 1930s, you have no notion of US climate history or what the 1930s heat wave and Dust Bowl were like. Perhaps you could pick up a copy of Grapes of Wrath again.

Quote:

Quote:

He also states that the Bay Area had temperatures reaching 120 back in the 1930s. I'd like to see some proof of that as I'm fairly confident that never happened, at least not with a properly set up thermometer in a reasonable location.

Update: I did a little research after posting this. Calistoga hit 117 or 118 a couple of years ago but maxed out at 114 in the 1930s. Most other Bay Area location record highs were 115 or lower and mainly happened in the last few years. Overall, few locations even had temperatures from the 1930s in their top ten. Go to https://xmacis.rcc-acis.org/ if you want to do your own research. The site does have a bit of a learning curve


Here is what I found for the Bay Area, a list from 2017:

https://abc7news.com/all-time-record-heat-bay-area-highest-temperatures-recorded-hot-weather-hottest-list/2366693/

Quote:

SAN FRANCISCO (KGO) -- With triple digit temps popping up across the Bay Area, many are wondering - when's the last time we saw weather like this and are we breaking any records?
Here's a look at the all-time high temperatures in the Bay Area:
SAN FRANCISCO:
  • 103 degrees in San Francisco on June 13, 2000 (record broken with 106 degrees in SF on Sept. 1, 2017)
  • 103 degrees at San Francisco international Airport on Sept. 14, 1971
EAST BAY:
  • 115 in Livermore on Sept. 3, 1950
  • 107 degrees in Richmond on Sept. 15, 1971
SOUTH BAY:
  • 115 degrees in Gilroy on July 15, 1972
PENINSULA:
  • 94 degrees in Half Moon Bay on Oct. 27, 2003
NORTH BAY:
  • 116 degrees in Healdsburg on July 13, 1972
  • 113 degrees in Santa Rosa on July 11, 1913
  • 114 degrees in Calistoga on July 4, 1931
  • 113 degrees in Napa on June 14, 1961
  • 112 degrees in Kentfield on July 11, 1913
  • 110 degrees in San Rafael on June 15, 1961
SOUTH BAY:
  • 109 degrees in San Jose on June 14, 2000
  • 106 degrees at Moffett Field on June 14, 2000


The 1930s held the most heat records across the US, but not in the Bay Area.

The populations of Calistoga, Napa, SJ or Livermore today are far larger than in decades past, and the modern urban layout far different, with parking lots, roads, buildings and concrete surfaces that replaced bare rolling hills or orchards. The effect from this, known as urban heat island, accounts for a temperature delta of over 10F. This is not taken into consideration by alarmists.
As is typical for you, when you're caught in an exaggeration, you come up with another exaggeration to try and explain the previous one away.

From the EPA:

"Heat islands are urbanized areas that experience higher temperatures than outlying areas. Structures such as buildings, roads, and other infrastructure absorb and re-emit the sun's heat more than natural landscapes such as forests and water bodies. Urban areas, where these structures are highly concentrated and greenery is limited, become "islands" of higher temperatures relative to outlying areas. Daytime temperatures in urban areas are about 1-7F higher than temperatures in outlying areas and nighttime temperatures are about 2-5F higher."


The thermal image of NYC posted above, reposted below, shows a difference in temperature between Central Park and JFK airport of about 14F-15F.


Most airports have weather stations and are part of the climate data.
So you're picking the difference between the most extreme points in NYC? I don't think that's a valid determination of the heat island effect. NYC is one of the most heavily urbanized areas. I don't think it's typical of other cities. Also, you've limited the data to 3 years worth of summers. What happens in the winter? Or over a longer period time? Climate normals are derived from 30 years of data. There's a reason why they do that.
Cal88
How long do you want to ignore this user?
Eastern Oregon Bear said:

Cal88 said:

Eastern Oregon Bear said:

Cal88 said:

Eastern Oregon Bear said:

dajo9 said:

Cal88's data from the 1930s is for the U.S. only because the U.S. did have an unprecedented heat wave in the 1930s but the globe did not. He is cherrypicking the data and science again. It is what he does. The full takedown can be read here.
https://www.google.com/amp/s/www.wfla.com/weather/climate-classroom/does-1930s-record-heat-undermine-the-science-of-man-made-climate-change/amp/
His first graph conveniently stops at 2018 and ignores the heat waves of the last 5 1/2 years. Cherrypicking again.


The most updated version of that curve I could find was on the EPA site, it goes through 2021, here it is:


Based on this comprehensive historical data, you would have to be a complete idiot to not understand that the 1930s was the hottest decade in the US - by a wide margin
https://www.epa.gov/climate-indicators/climate-change-indicators-heat-waves (look for Figure 3)

If you believe the data from 2022-24 which will come out in a couple of years is going to approach that of the 1930s, you have no notion of US climate history or what the 1930s heat wave and Dust Bowl were like. Perhaps you could pick up a copy of Grapes of Wrath again.

Quote:

Quote:

He also states that the Bay Area had temperatures reaching 120 back in the 1930s. I'd like to see some proof of that as I'm fairly confident that never happened, at least not with a properly set up thermometer in a reasonable location.

Update: I did a little research after posting this. Calistoga hit 117 or 118 a couple of years ago but maxed out at 114 in the 1930s. Most other Bay Area location record highs were 115 or lower and mainly happened in the last few years. Overall, few locations even had temperatures from the 1930s in their top ten. Go to https://xmacis.rcc-acis.org/ if you want to do your own research. The site does have a bit of a learning curve


Here is what I found for the Bay Area, a list from 2017:

https://abc7news.com/all-time-record-heat-bay-area-highest-temperatures-recorded-hot-weather-hottest-list/2366693/

Quote:

SAN FRANCISCO (KGO) -- With triple digit temps popping up across the Bay Area, many are wondering - when's the last time we saw weather like this and are we breaking any records?
Here's a look at the all-time high temperatures in the Bay Area:
SAN FRANCISCO:
  • 103 degrees in San Francisco on June 13, 2000 (record broken with 106 degrees in SF on Sept. 1, 2017)
  • 103 degrees at San Francisco international Airport on Sept. 14, 1971
EAST BAY:
  • 115 in Livermore on Sept. 3, 1950
  • 107 degrees in Richmond on Sept. 15, 1971
SOUTH BAY:
  • 115 degrees in Gilroy on July 15, 1972
PENINSULA:
  • 94 degrees in Half Moon Bay on Oct. 27, 2003
NORTH BAY:
  • 116 degrees in Healdsburg on July 13, 1972
  • 113 degrees in Santa Rosa on July 11, 1913
  • 114 degrees in Calistoga on July 4, 1931
  • 113 degrees in Napa on June 14, 1961
  • 112 degrees in Kentfield on July 11, 1913
  • 110 degrees in San Rafael on June 15, 1961
SOUTH BAY:
  • 109 degrees in San Jose on June 14, 2000
  • 106 degrees at Moffett Field on June 14, 2000


The 1930s held the most heat records across the US, but not in the Bay Area.

The populations of Calistoga, Napa, SJ or Livermore today are far larger than in decades past, and the modern urban layout far different, with parking lots, roads, buildings and concrete surfaces that replaced bare rolling hills or orchards. The effect from this, known as urban heat island, accounts for a temperature delta of over 10F. This is not taken into consideration by alarmists.
As is typical for you, when you're caught in an exaggeration, you come up with another exaggeration to try and explain the previous one away.

From the EPA:

"Heat islands are urbanized areas that experience higher temperatures than outlying areas. Structures such as buildings, roads, and other infrastructure absorb and re-emit the sun's heat more than natural landscapes such as forests and water bodies. Urban areas, where these structures are highly concentrated and greenery is limited, become "islands" of higher temperatures relative to outlying areas. Daytime temperatures in urban areas are about 1-7F higher than temperatures in outlying areas and nighttime temperatures are about 2-5F higher."


The thermal image of NYC posted above, reposted below, shows a difference in temperature between Central Park and JFK airport of about 14F-15F.


Most airports have weather stations and are part of the climate data.
So you're picking the difference between the most extreme points in NYC? I don't think that's a valid determination of the heat island effect. NYC is one of the most heavily urbanized areas. I don't think it's typical of other cities. Also, you've limited the data to 3 years worth of summers. What happens in the winter? Or over a longer period time? Climate normals are derived from 30 years of data. There's a reason why they do that.


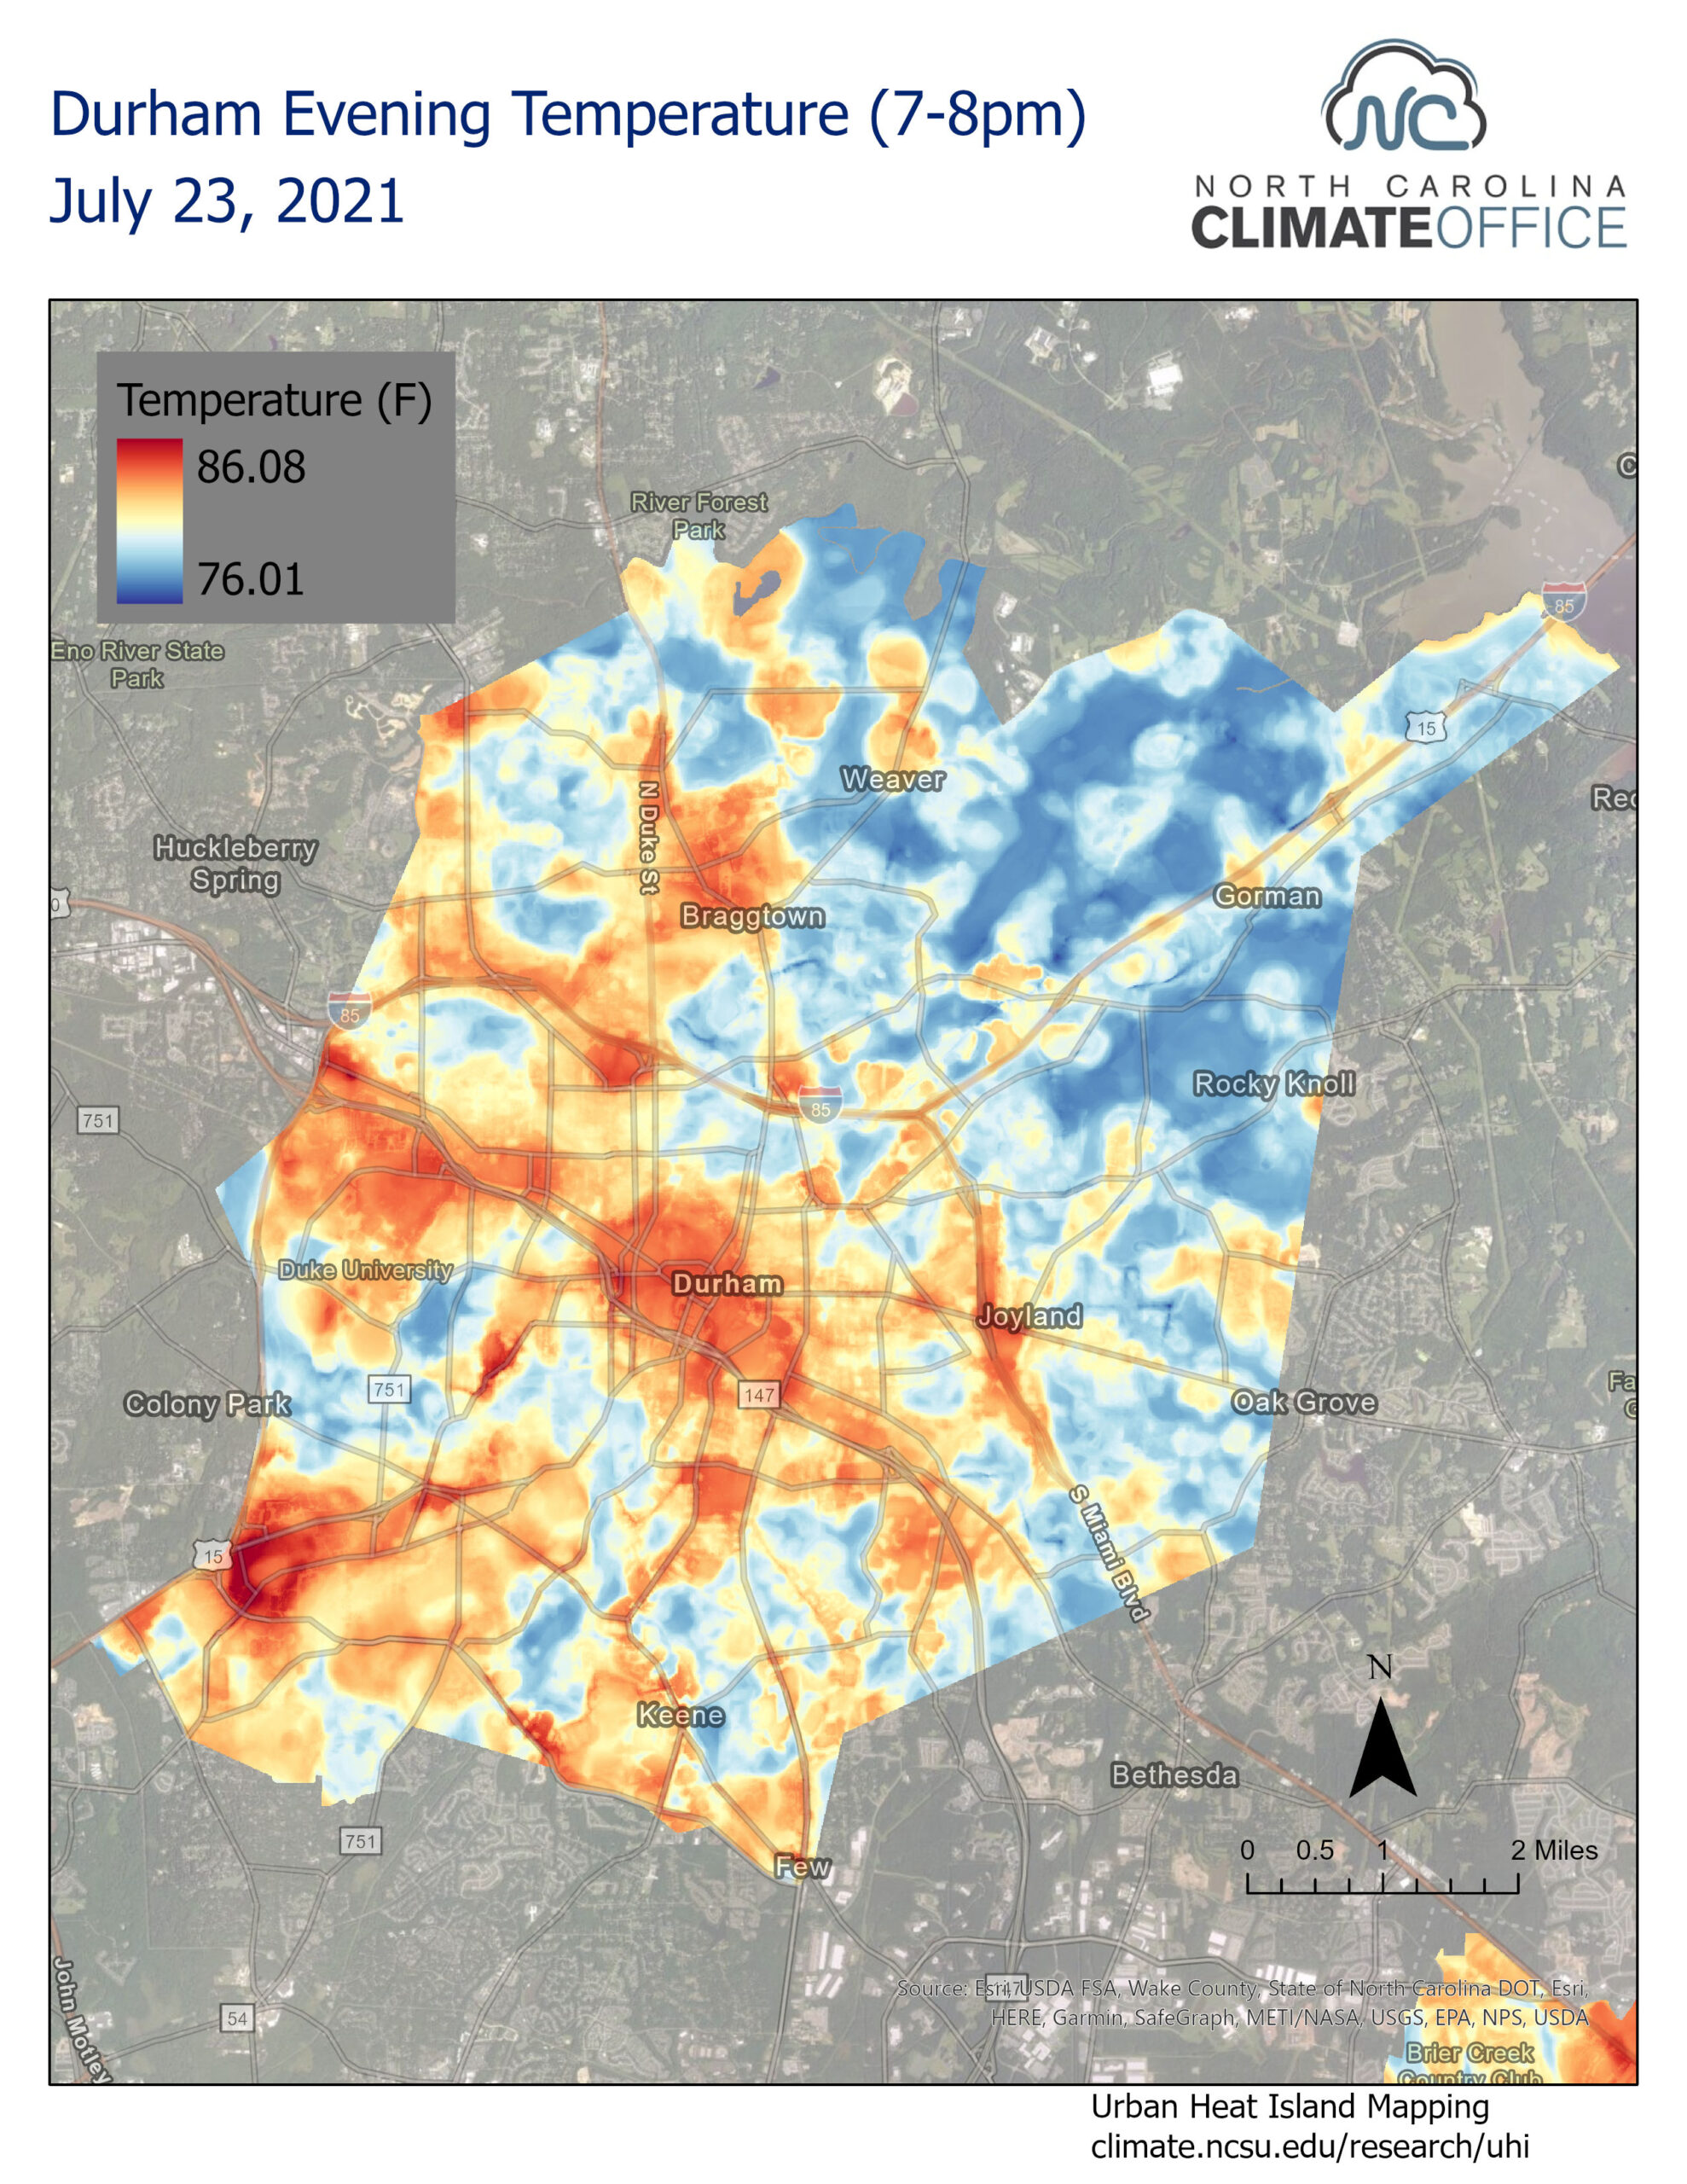
Here's the UHI pattern for Durham, NC, pop. 290,000, which came up near the top of a google search on UHI map images, showing a 10F differential between urban centers and rural parts.


The UHI effect takes place in daytime and nighttime, and in winter as well, when it is actually beneficial, though it is most often mentioned in reference with Summer as it exacerbates heat waves:
https://www.sciencedaily.com/releases/2018/07/180723143002.htm

Even on cloudy days, you have some UHI (albeit lower) due to human activity. The main factor that lowers UHI are high winds.
AunBear89
How long do you want to ignore this user?
The conservative side of the climate change argument is fueled by antiregulatory commercial interests (in other words, the Republican Donor Class).

Corporations don't like being regulated. Responding to and taking action about water quality, air pollution, waste, and climate change require regulatory action and oversight - the corporations aren't doing it themselves because profits.

The recent Chevron decision has most conservatives in a state of arousal. Fewer pesky regulations, more profit! Who cares about pollution and greenhouse gases?

"That's all fake news. Look at these curated charts and graphs from the petroleum industry! See? The planet always sets worldwide record temps because it did it once in the dust bowl in 1930s."
"There are three kinds of lies: lies, damned lies, and statistics." -- (maybe) Benjamin Disraeli, popularized by Mark Twain
oski003
How long do you want to ignore this user?
AunBear89 said:

The conservative side of the climate change argument is fueled by antiregulatory commercial interests (in other words, the Republican Donor Class).

Corporations don't like being regulated. Responding to and taking action about water quality, air pollution, waste, and climate change require regulatory action and oversight - the corporations aren't doing it themselves because profits.

The recent Chevron decision has most conservatives in a state of arousal. Fewer pesky regulations, more profit! Who cares about pollution and greenhouse gases?

"That's all fake news. Look at these curated charts and graphs from the petroleum industry! See? The planet always sets worldwide record temps because it did it once in the dust bowl in 1930s."


There is also a large booming CORPORATE green industry.
dajo9
How long do you want to ignore this user?
Global heat is exploding and Cal88 is waiving around pockets of data to distract
Cal88
How long do you want to ignore this user?
dajo9 said:

Global heat is exploding and Cal88 is waiving around pockets of data to distract

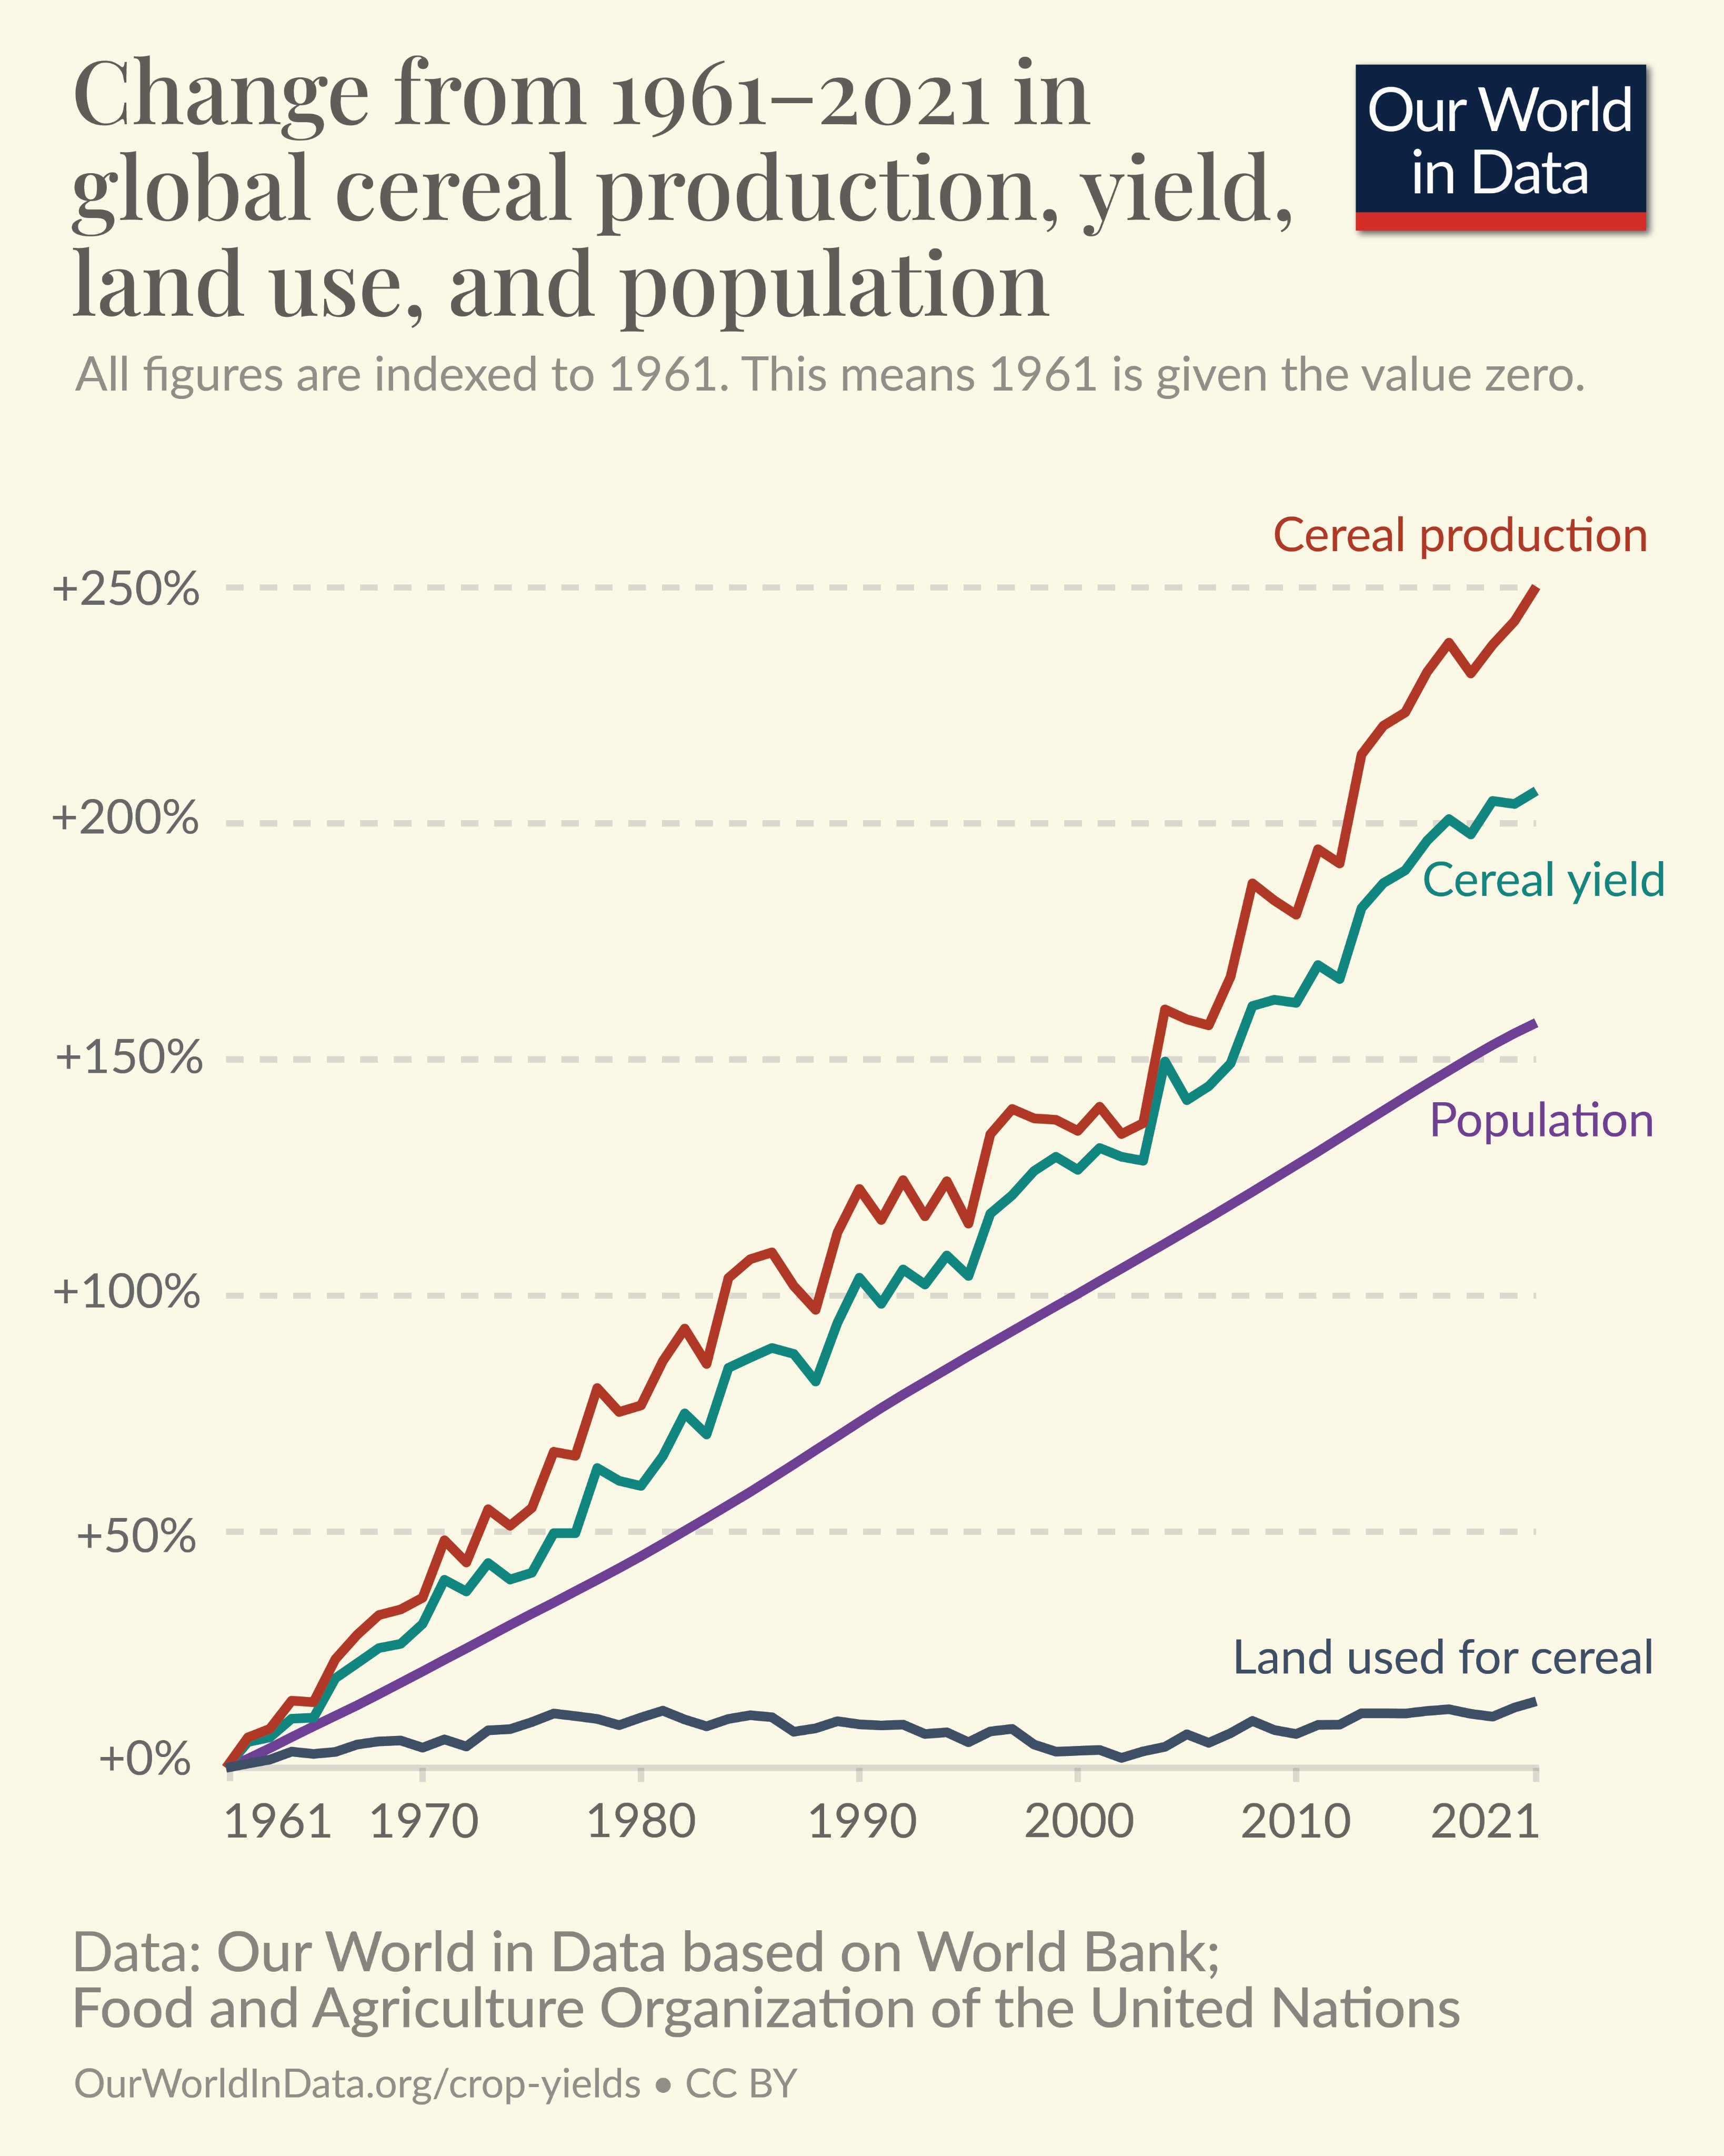
Is this the picture of "exploding global heat"?


What is exploding here is global agricultural output, fueled in part by rising CO2 levels (especially in more arid climates where the CO2 fertilizing effect is more manifest).
Eastern Oregon Bear
How long do you want to ignore this user?
Cal88 said:

Eastern Oregon Bear said:

Cal88 said:

Eastern Oregon Bear said:

Cal88 said:

Eastern Oregon Bear said:

dajo9 said:

Cal88's data from the 1930s is for the U.S. only because the U.S. did have an unprecedented heat wave in the 1930s but the globe did not. He is cherrypicking the data and science again. It is what he does. The full takedown can be read here.
https://www.google.com/amp/s/www.wfla.com/weather/climate-classroom/does-1930s-record-heat-undermine-the-science-of-man-made-climate-change/amp/
His first graph conveniently stops at 2018 and ignores the heat waves of the last 5 1/2 years. Cherrypicking again.


The most updated version of that curve I could find was on the EPA site, it goes through 2021, here it is:


Based on this comprehensive historical data, you would have to be a complete idiot to not understand that the 1930s was the hottest decade in the US - by a wide margin
https://www.epa.gov/climate-indicators/climate-change-indicators-heat-waves (look for Figure 3)

If you believe the data from 2022-24 which will come out in a couple of years is going to approach that of the 1930s, you have no notion of US climate history or what the 1930s heat wave and Dust Bowl were like. Perhaps you could pick up a copy of Grapes of Wrath again.

Quote:

Quote:

He also states that the Bay Area had temperatures reaching 120 back in the 1930s. I'd like to see some proof of that as I'm fairly confident that never happened, at least not with a properly set up thermometer in a reasonable location.

Update: I did a little research after posting this. Calistoga hit 117 or 118 a couple of years ago but maxed out at 114 in the 1930s. Most other Bay Area location record highs were 115 or lower and mainly happened in the last few years. Overall, few locations even had temperatures from the 1930s in their top ten. Go to https://xmacis.rcc-acis.org/ if you want to do your own research. The site does have a bit of a learning curve


Here is what I found for the Bay Area, a list from 2017:

https://abc7news.com/all-time-record-heat-bay-area-highest-temperatures-recorded-hot-weather-hottest-list/2366693/

Quote:

SAN FRANCISCO (KGO) -- With triple digit temps popping up across the Bay Area, many are wondering - when's the last time we saw weather like this and are we breaking any records?
Here's a look at the all-time high temperatures in the Bay Area:
SAN FRANCISCO:
  • 103 degrees in San Francisco on June 13, 2000 (record broken with 106 degrees in SF on Sept. 1, 2017)
  • 103 degrees at San Francisco international Airport on Sept. 14, 1971
EAST BAY:
  • 115 in Livermore on Sept. 3, 1950
  • 107 degrees in Richmond on Sept. 15, 1971
SOUTH BAY:
  • 115 degrees in Gilroy on July 15, 1972
PENINSULA:
  • 94 degrees in Half Moon Bay on Oct. 27, 2003
NORTH BAY:
  • 116 degrees in Healdsburg on July 13, 1972
  • 113 degrees in Santa Rosa on July 11, 1913
  • 114 degrees in Calistoga on July 4, 1931
  • 113 degrees in Napa on June 14, 1961
  • 112 degrees in Kentfield on July 11, 1913
  • 110 degrees in San Rafael on June 15, 1961
SOUTH BAY:
  • 109 degrees in San Jose on June 14, 2000
  • 106 degrees at Moffett Field on June 14, 2000


The 1930s held the most heat records across the US, but not in the Bay Area.

The populations of Calistoga, Napa, SJ or Livermore today are far larger than in decades past, and the modern urban layout far different, with parking lots, roads, buildings and concrete surfaces that replaced bare rolling hills or orchards. The effect from this, known as urban heat island, accounts for a temperature delta of over 10F. This is not taken into consideration by alarmists.
As is typical for you, when you're caught in an exaggeration, you come up with another exaggeration to try and explain the previous one away.

From the EPA:

"Heat islands are urbanized areas that experience higher temperatures than outlying areas. Structures such as buildings, roads, and other infrastructure absorb and re-emit the sun's heat more than natural landscapes such as forests and water bodies. Urban areas, where these structures are highly concentrated and greenery is limited, become "islands" of higher temperatures relative to outlying areas. Daytime temperatures in urban areas are about 1-7F higher than temperatures in outlying areas and nighttime temperatures are about 2-5F higher."


The thermal image of NYC posted above, reposted below, shows a difference in temperature between Central Park and JFK airport of about 14F-15F.


Most airports have weather stations and are part of the climate data.
So you're picking the difference between the most extreme points in NYC? I don't think that's a valid determination of the heat island effect. NYC is one of the most heavily urbanized areas. I don't think it's typical of other cities. Also, you've limited the data to 3 years worth of summers. What happens in the winter? Or over a longer period time? Climate normals are derived from 30 years of data. There's a reason why they do that.


Here's the UHI pattern for Durham, NC, pop. 290,000, which came up near the top of a google search on UHI map images, showing a 10F differential between urban centers and rural parts.


The UHI effect takes place in evenings, and in winter as well, when it is actually beneficial, though it is most often mentioned in reference with Summer as it exacerbates heat waves:
https://www.sciencedaily.com/releases/2018/07/180723143002.htm

Even on cloudy days, you have some UHI (albeit lower) due to human activity. The main factor that lowers UHI are high winds.
I think you'd have to have data for more than one hour on one day to reach any significant conclusion. What happens in January or October? Or even July 15th or July 31st? What happens at 2-3 AM or 2-3 PM? Again you're cherry picking the most extreme data you can find.
Eastern Oregon Bear
How long do you want to ignore this user?
Cal88 said:

dajo9 said:

Global heat is exploding and Cal88 is waiving around pockets of data to distract

Is this the picture of "exploding global heat"?


What is exploding here is global agricultural output, fueled in part by rising CO2 levels (especially in more arid climates where the CO2 fertilizing effect is more manifest).
Hey, if CO2 increases heat and that increases crop yields, lets pump up CO2 to triple current levels and bring average daily high temperatures to 130 or 140. That'll solve the world's hunger problems! Win-win for everyone!

All joking aside, there are plenty of factors influencing crop yields that you're ignoring. Better yielding strains of most crops for one. Better and more available farming equipment and pest management for another.
Cal88
How long do you want to ignore this user?
Eastern Oregon Bear said:

Cal88 said:

dajo9 said:

Global heat is exploding and Cal88 is waiving around pockets of data to distract

Is this the picture of "exploding global heat"?


What is exploding here is global agricultural output, fueled in part by rising CO2 levels (especially in more arid climates where the CO2 fertilizing effect is more manifest).
Hey, if CO2 increases heat and that increases crop yields, lets pump up CO2 to triple current levels and bring average daily high temperatures to 130 or 140. That'll solve the world's hunger problems! Win-win for everyone!

All joking aside, there are plenty of factors influencing crop yields that you're ignoring. Better yielding strains of most crops for one. Better and more available farming equipment and pest management for another.

Interestingly enough, that's precisely what greenhouse operators do, they pump up CO2 levels by a factor of 3 and get increases in yields above 30% for crops like tomatoes or lettuce.


Increases in CO2 have been the primary factor in the ongoing greening of the earth and the decline of the Sahara Desert, which shrunk by around 10% in the past 3 decades:
https://www.thegwpf.org/images/stories/gwpf-reports/mueller-sahel.pdf
https://science.nasa.gov/earth/climate-change/co2-is-making-earth-greenerfor-now/

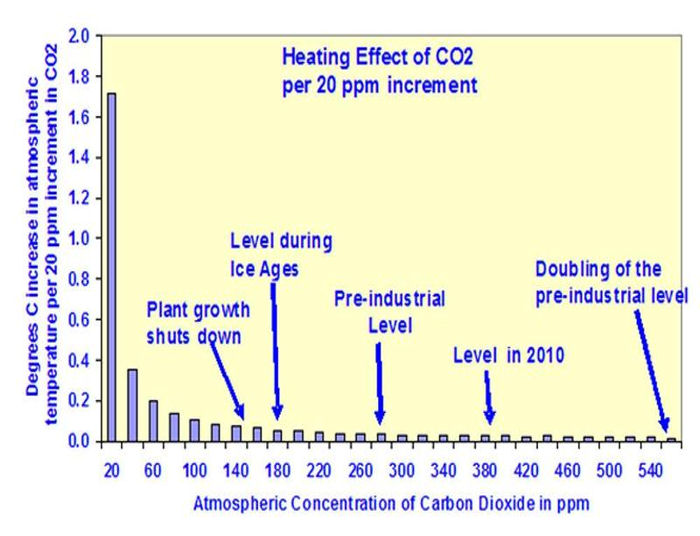
Temperatures don't go up linearly along with CO2 concentrations, the relation is logarithmic, meaning you have to double CO2 concentrations in order to get the same rise in temperatures, due to the saturation effect.


In historic times when CO2 levels were up to 15 times higher, earth ecosystems florished and temperatures never got to 130-150, that's ridiculous.


As to the UHI, it applies round the clock, with the biggest temperature delta observed at night as the heat stored in urban landscapes is released while the rural/green areas have far smaller temperature inertia. UHI effect also applies in winter, as shown in the Princeton study linked above.
Eastern Oregon Bear
How long do you want to ignore this user?
Cal88 said:

Eastern Oregon Bear said:

Cal88 said:

dajo9 said:

Global heat is exploding and Cal88 is waiving around pockets of data to distract

Is this the picture of "exploding global heat"?


What is exploding here is global agricultural output, fueled in part by rising CO2 levels (especially in more arid climates where the CO2 fertilizing effect is more manifest).
Hey, if CO2 increases heat and that increases crop yields, lets pump up CO2 to triple current levels and bring average daily high temperatures to 130 or 140. That'll solve the world's hunger problems! Win-win for everyone!

All joking aside, there are plenty of factors influencing crop yields that you're ignoring. Better yielding strains of most crops for one. Better and more available farming equipment and pest management for another.

Interestingly enough, that's precisely what greenhouse operators do, they pump up CO2 levels by a factor of 3 and get increases in yields above 30% for crops like tomatoes or lettuce.


Increases in CO2 have been the primary factor in the ongoing greening of the earth and the decline of the Sahara Desert, which shrunk by around 10% in the past 3 decades:
https://www.thegwpf.org/images/stories/gwpf-reports/mueller-sahel.pdf
https://science.nasa.gov/earth/climate-change/co2-is-making-earth-greenerfor-now/

Temperatures don't go up linearly along with CO2 concentrations, the relation is logarithmic, meaning you have to double CO2 concentrations in order to get the same rise in temperatures, due to the saturation effect.


In historic times when CO2 levels were up to 15 times higher, earth ecosystems florished and temperatures never got to 130-150, that's ridiculous.


As to the UHI, it applies round the clock, with the biggest temperature delta observed at night as the heat stored in urban landscapes is released while the rural/green areas have far smaller temperature inertia. UHI effect also applies in winter, as shown in the Princeton study linked above.
Nice job changing my 130 to 140 degrees to 130 to 150. I'm sure it was just an accidental typo.

Since you've shifted the goal posts to crop yields, I'm not going to waste anymore of my time debating that other than to point out that a greenhouse is a very different situation than the great outdoors for more reasons than CO2 concentrations.

As for your Princeton study, your link to a synopsis of it says "Urban heat islands have been extensively studied during heat waves, with recent analyses showing city temperature boosts can be as high as 8 degrees Fahrenheit for large cities like New York City or Washington." That's a far cry from the 14 degrees you claimed up thread.
AunBear89
How long do you want to ignore this user?
Thank you, conservahumper003, for providing that useless detail.

Come back when you have annual earnings comparisons between petroleum related companies and these green companies you clowns get all "butwhatabout" over?


"There are three kinds of lies: lies, damned lies, and statistics." -- (maybe) Benjamin Disraeli, popularized by Mark Twain
oski003
How long do you want to ignore this user?
AunBear89 said:

Thank you, conservahumper003, for providing that useless detail.

Come back when you have annual earnings comparisons between petroleum related companies and these green companies you clowns get all "butwhatabout" over?


Bidenguzzler89, Tesla made about 15 billion in 2023. Here is what I found for Chevron:

Chevron Corporation reported a net income of some 21.37 billion U.S. dollars in 2023. In 2020, the company recorded a net loss of 5.54 billion U.S. dollars
AunBear89
How long do you want to ignore this user?
Tesla? A green company?

You're as stupid as you act.


And I don't guzzle anyone, let alone Biden. Yet you fall to your knees and whip out the lip balm for Trump and every conservative incel on BI.
"There are three kinds of lies: lies, damned lies, and statistics." -- (maybe) Benjamin Disraeli, popularized by Mark Twain
oski003
How long do you want to ignore this user?
AunBear89 said:

Tesla? A green company?

You're as stupid as you act.


And I don't guzzle anyone, let alone Biden. Yet you fall to your knees and whip out the lip balm for Trump and every conservative incel on BI.


Yes, Tesla is a green company. Thanks.
bearister
How long do you want to ignore this user?
oski003 said:

AunBear89 said:

Tesla? A green company?

You're as stupid as you act.


And I don't guzzle anyone, let alone Biden. Yet you fall to your knees and whip out the lip balm for Trump and every conservative incel on BI.


Yes, Tesla is a green company. Thanks.

Maybe a green company on its business cards and mission statement.

Tesla sued over air pollution from factory in Fremont, California


https://www.cnbc.com/2024/05/14/tesla-sued-over-air-pollution-from-factory-in-fremont-california.html

"Tesla landed at 89 on the 2023 Toxic 100 Air Polluters list, an annual study by the Political Economy Research Institute at the University of Massachusetts at Amherst. The Environmental Protection Agency fined Tesla $275,000 in 2022, saying the company had failed to measure, track and maintain records about its own emissions or to minimize air pollutants from painting operations at the facility.

Separately, Tesla was sued by 25 counties in California for its handling of hazardous waste materials at facilities throughout the state earlier this year, and promptly settled with those counties. And in Germany, environmentalists have been protesting Tesla's clearing of forests to build a factory outside Berlin, as well as the company's water consumption."
Cancel my subscription to the Resurrection
Send my credentials to the House of Detention
I got some friends inside
oski003
How long do you want to ignore this user?
bearister said:

oski003 said:

AunBear89 said:

Tesla? A green company?

You're as stupid as you act.


And I don't guzzle anyone, let alone Biden. Yet you fall to your knees and whip out the lip balm for Trump and every conservative incel on BI.


Yes, Tesla is a green company. Thanks.

Maybe a green company on its business cards and mission statement.

Tesla sued over air pollution from factory in Fremont, California


https://www.cnbc.com/2024/05/14/tesla-sued-over-air-pollution-from-factory-in-fremont-california.html

"Tesla landed at 89 on the 2023 Toxic 100 Air Polluters list, an annual study by the Political Economy Research Institute at the University of Massachusetts at Amherst. The Environmental Protection Agency fined Tesla $275,000 in 2022, saying the company had failed to measure, track and maintain records about its own emissions or to minimize air pollutants from painting operations at the facility.

Separately, Tesla was sued by 25 counties in California for its handling of hazardous waste materials at facilities throughout the state earlier this year, and promptly settled with those counties. And in Germany, environmentalists have been protesting Tesla's clearing of forests to build a factory outside Berlin, as well as the company's water consumption."


I am aware of this and, yes, Tesla is a green company, especially in the context of the discussion between me and the angry muppet.
Eastern Oregon Bear
How long do you want to ignore this user?
oski003 said:

bearister said:

oski003 said:

AunBear89 said:

Tesla? A green company?

You're as stupid as you act.


And I don't guzzle anyone, let alone Biden. Yet you fall to your knees and whip out the lip balm for Trump and every conservative incel on BI.


Yes, Tesla is a green company. Thanks.

Maybe a green company on its business cards and mission statement.

Tesla sued over air pollution from factory in Fremont, California


https://www.cnbc.com/2024/05/14/tesla-sued-over-air-pollution-from-factory-in-fremont-california.html

"Tesla landed at 89 on the 2023 Toxic 100 Air Polluters list, an annual study by the Political Economy Research Institute at the University of Massachusetts at Amherst. The Environmental Protection Agency fined Tesla $275,000 in 2022, saying the company had failed to measure, track and maintain records about its own emissions or to minimize air pollutants from painting operations at the facility.

Separately, Tesla was sued by 25 counties in California for its handling of hazardous waste materials at facilities throughout the state earlier this year, and promptly settled with those counties. And in Germany, environmentalists have been protesting Tesla's clearing of forests to build a factory outside Berlin, as well as the company's water consumption."


I am aware of this and, yes, Tesla is a green company, especially in the context of the discussion between me and the angry muppet.
Just between you and him, it's not easy being green.
AunBear89
How long do you want to ignore this user?
As if mouthbreather003 understands anything.

But I'm happy that others are engaging with his preschool debate tactics.
He feels so grownup when he pretends to be smart.
"There are three kinds of lies: lies, damned lies, and statistics." -- (maybe) Benjamin Disraeli, popularized by Mark Twain
 
×
subscribe Verify your student status
See Subscription Benefits
Trial only available to users who have never subscribed or participated in a previous trial.