Eastern Oregon Bear said:
dajo9 said:
Cal88's data from the 1930s is for the U.S. only because the U.S. did have an unprecedented heat wave in the 1930s but the globe did not. He is cherrypicking the data and science again. It is what he does. The full takedown can be read here.
https://www.google.com/amp/s/www.wfla.com/weather/climate-classroom/does-1930s-record-heat-undermine-the-science-of-man-made-climate-change/amp/
His first graph conveniently stops at 2018 and ignores the heat waves of the last 5 1/2 years. Cherrypicking again.
The most updated version of that curve I could find was on the EPA site, it goes through 2021, here it is:
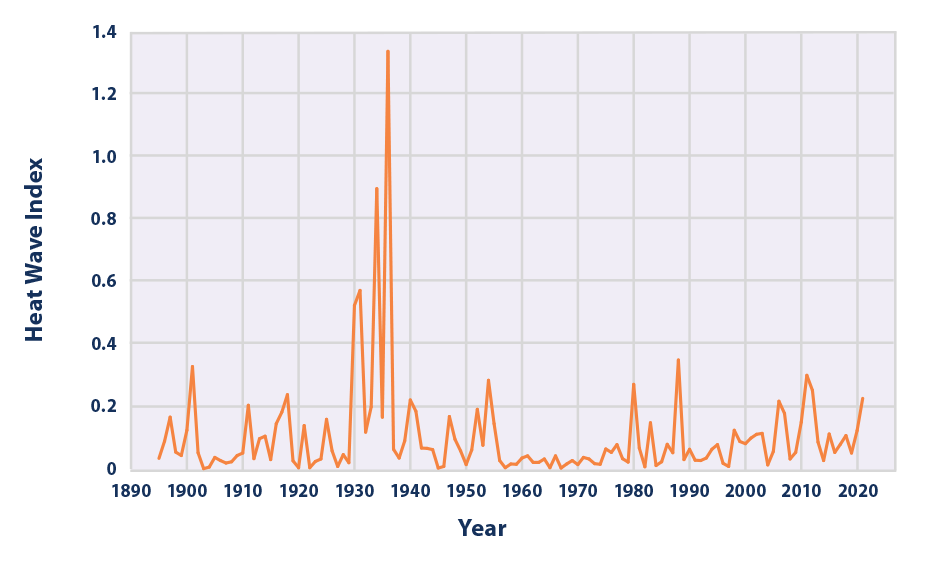
Based on this comprehensive historical data, you would have to be a complete idiot to not understand that the 1930s was the hottest decade in the US - by a wide margin
https://www.epa.gov/climate-indicators/climate-change-indicators-heat-waves (look for Figure 3)
If you believe the data from 2022-24 which will come out in a couple of years is going to approach that of the 1930s, you have no notion of US climate history or what the 1930s heat wave and Dust Bowl were like. Perhaps you could pick up a copy of Grapes of Wrath again.
Quote:
Quote:
He also states that the Bay Area had temperatures reaching 120 back in the 1930s. I'd like to see some proof of that as I'm fairly confident that never happened, at least not with a properly set up thermometer in a reasonable location.
Update: I did a little research after posting this. Calistoga hit 117 or 118 a couple of years ago but maxed out at 114 in the 1930s. Most other Bay Area location record highs were 115 or lower and mainly happened in the last few years. Overall, few locations even had temperatures from the 1930s in their top ten. Go to https://xmacis.rcc-acis.org/ if you want to do your own research. The site does have a bit of a learning curve
Here is what I found for the Bay Area, a list from 2017:
https://abc7news.com/all-time-record-heat-bay-area-highest-temperatures-recorded-hot-weather-hottest-list/2366693/Quote:
SAN FRANCISCO (KGO) -- With triple digit temps popping up across the Bay Area, many are wondering - when's the last time we saw weather like this and are we breaking any records?
Here's a look at the all-time high temperatures in the Bay Area:
SAN FRANCISCO:
- 103 degrees in San Francisco on June 13, 2000 (record broken with 106 degrees in SF on Sept. 1, 2017)
- 103 degrees at San Francisco international Airport on Sept. 14, 1971
EAST BAY:
- 115 in Livermore on Sept. 3, 1950
- 107 degrees in Richmond on Sept. 15, 1971
SOUTH BAY:
- 115 degrees in Gilroy on July 15, 1972
PENINSULA:
- 94 degrees in Half Moon Bay on Oct. 27, 2003
NORTH BAY:
- 116 degrees in Healdsburg on July 13, 1972
- 113 degrees in Santa Rosa on July 11, 1913
- 114 degrees in Calistoga on July 4, 1931
- 113 degrees in Napa on June 14, 1961
- 112 degrees in Kentfield on July 11, 1913
- 110 degrees in San Rafael on June 15, 1961
SOUTH BAY:
- 109 degrees in San Jose on June 14, 2000
- 106 degrees at Moffett Field on June 14, 2000
The 1930s held the most heat records
across the US, but not in the Bay Area.
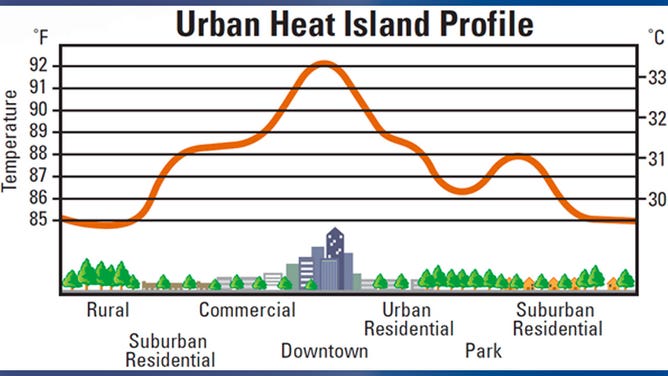
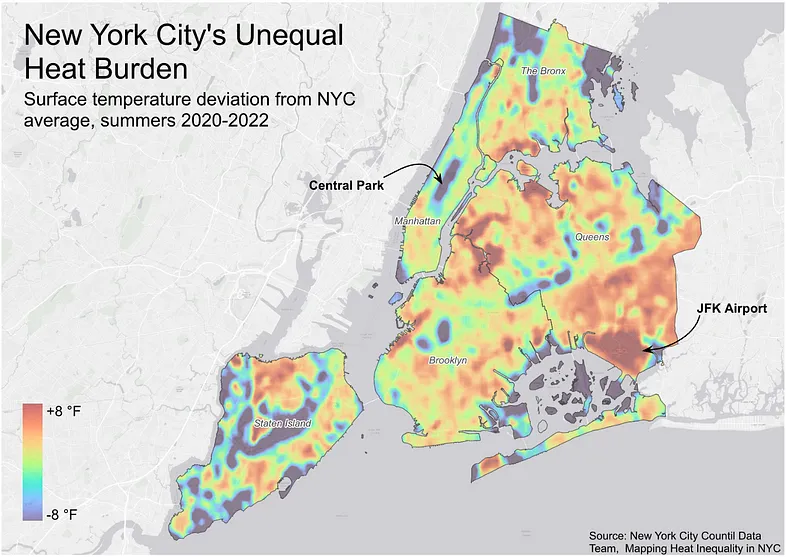
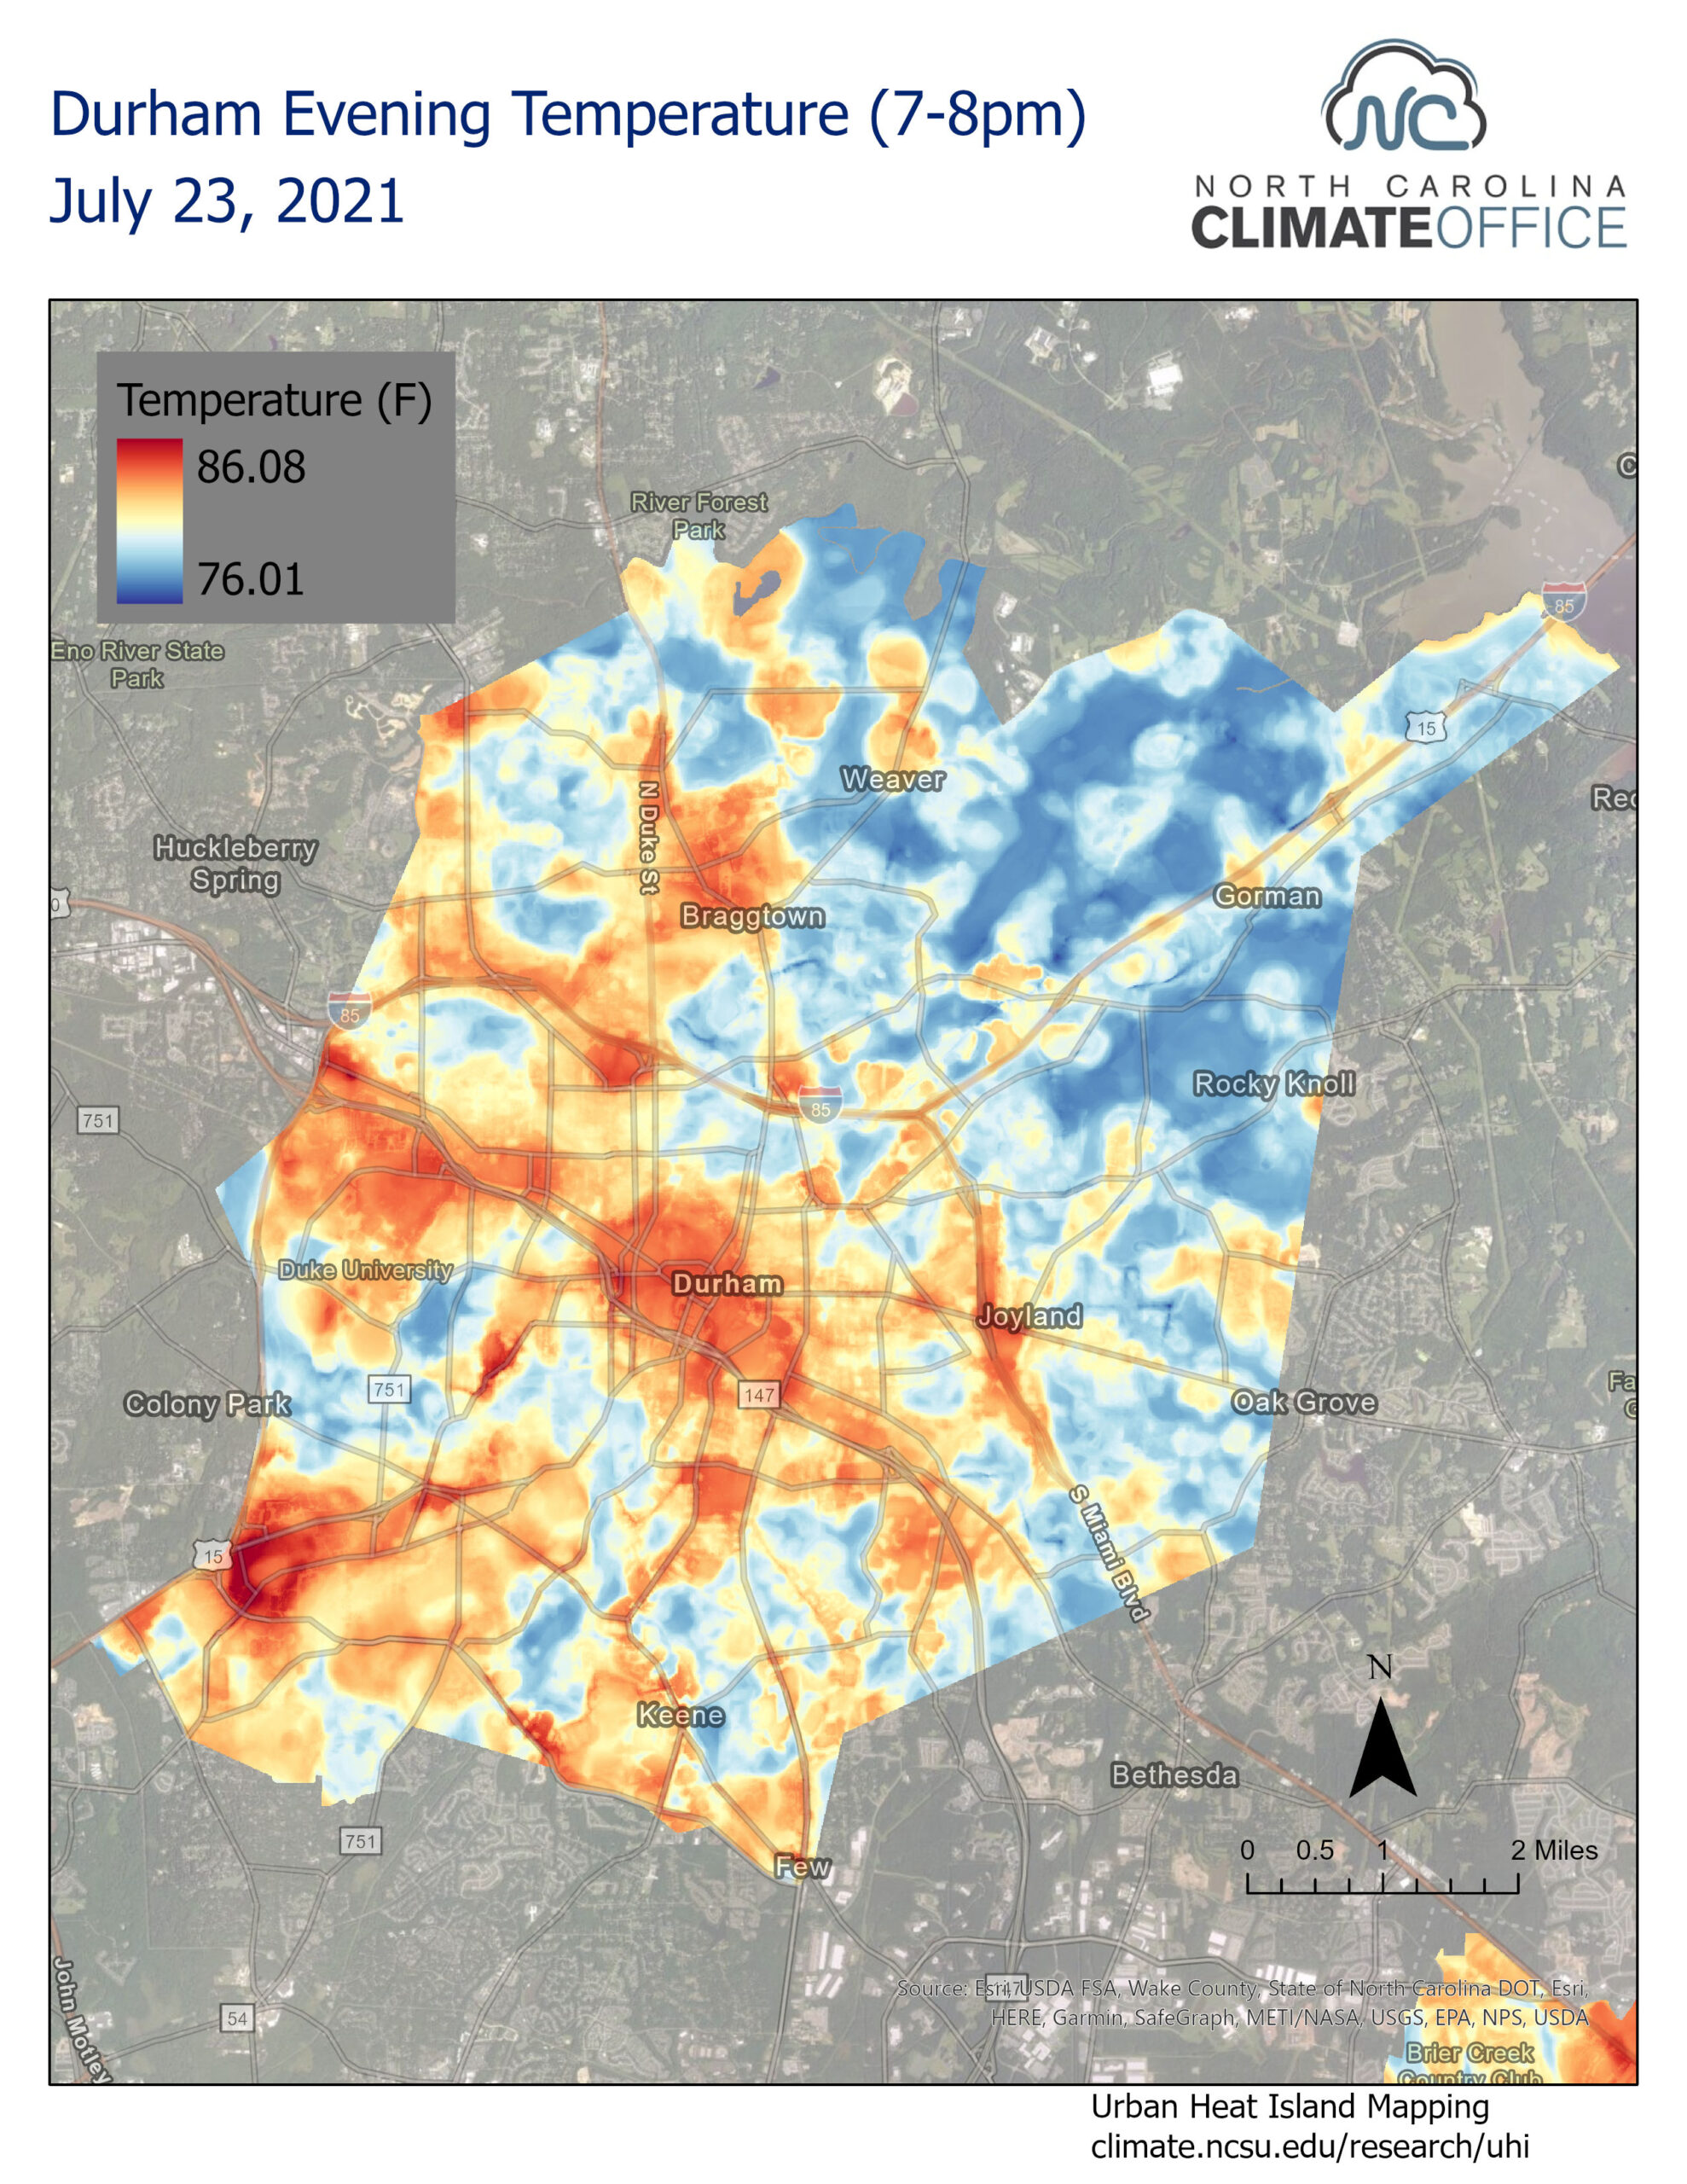
The populations of Calistoga, Napa, SJ or Livermore today are far larger than in decades past, and the modern urban layout far different, with parking lots, roads, buildings and concrete surfaces that replaced bare rolling hills or orchards. The effect from this, known as urban heat island, accounts for a temperature delta of over 10F. This is not taken into consideration by alarmists.